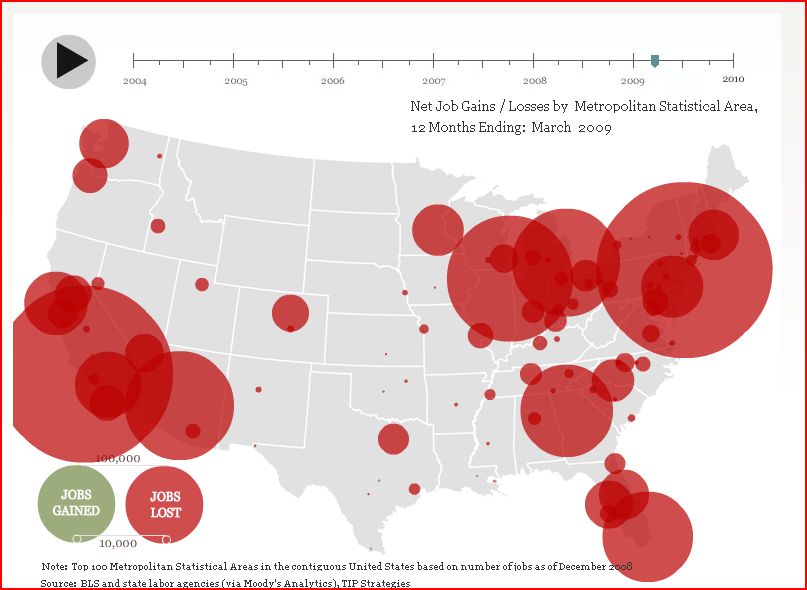
This map illustrates the geographic distribution of job amongst the 100 largest metropolitan areas in the USA. The time period is the twelve months that ended March 31, 2009. The graphic was prepared by TIP Strategies based on data obtained via Moody's Analytics and produced by the Bureau of Labor Statistics of the U.S. Department of Labor.
