
ARES Urbanexus Update #174
The American Real Estate Society (ARES) distributes this monthly newsletter, which features news and information about real estate and metropolitan development curated by H. Pike Oliver.
NOTE: Due to vacation, the next update will be distributed in July 2025.
Office
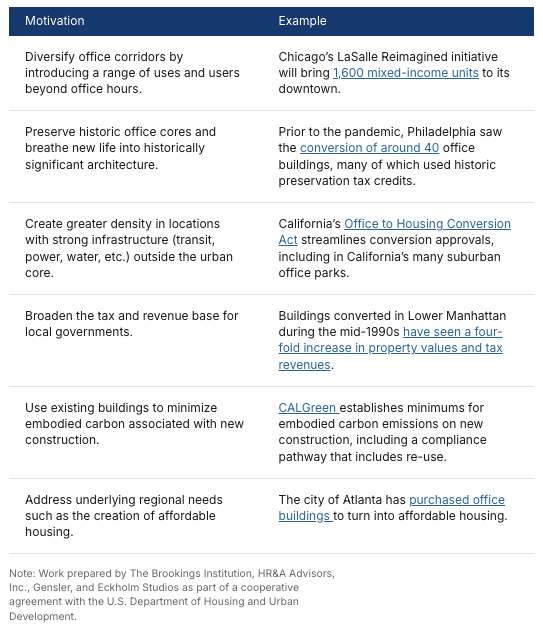
Jurisdictional motivations for office-to-residential conversion
The Brookings Institution has published the first part of a broader series examining the potential of office-to-residential conversions across six U.S. case studies. This project is part of a cooperative agreement with the US Department of Housing and Urban Development, and the research team consists of contributors from Gensler, HR&A Advisors, Brookings, and Eckholm Studios.
The initial study's purpose is to provide a framework for understanding local office and housing market conditions and to detail policies and incentives that spur conversion, affirmatively further fair housing, or some combination of both. It includes illustrative case studies demonstrating how different combinations of policies related to office-to-residential conversion generate activity in the six representative cities.
The study team reviewed office-to-residential (O2R) conversion activities in U.S. cities and identified several overlapping motivations for why real estate actors and local jurisdictions pursue O2R conversions. These motivations are summarized and illustrated in the following table. Learn more here.
Return to office lags in San Francisco
Despite high-profile return-to-office mandates, workers in San Francisco continue to lag behind the rest of the country in returning to the office. According to data from Placer.ai and Kastle, office attendance in San Francisco remains the lowest among major U.S. cities, even with some improvements over the past two years.
Placer.ai tracks foot traffic using cellphone locations, estimating employee visits based on specific criteria, while Kastle records security card swipes across 2,600 buildings nationwide. Their findings indicate that San Francisco is falling behind nearly everywhere else.
In March, Placer.ai reported a nearly 10% increase in San Francisco's office recovery percentage, which marked one of the largest jumps among the 12 cities in its index. However, this still leaves San Francisco trailing the national average

But those numbers are still far behind almost every other metro in Placer.ai’s reporting and the national average. Nationally, Placer.ai estimated that 68% of foot traffic had returned to office buildings in March—13 percentage points higher than in San Francisco.
Likewise, Kastle, which measures return to office on a weekly basis, found that for the week ending on April 2, just 42% of workers had returned to San Francisco offices, compared to 54% nationally. As with Placer.ai, San Francisco’s recovery ranked last among the 10 major cities in Kastle’s index.
Learn more here.

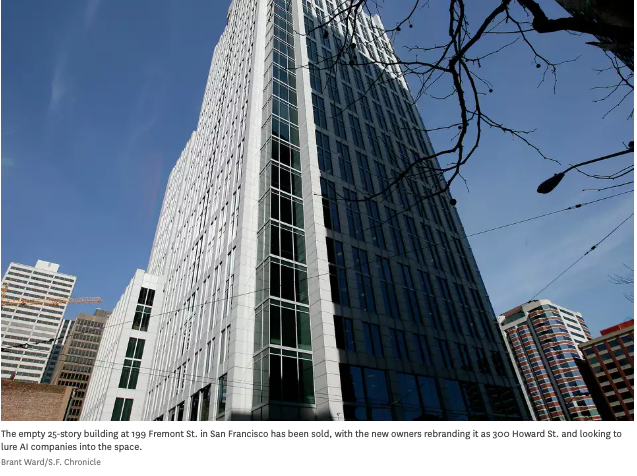
S.F. office building lost 70% of its value in five years
According to property records, a vacant downtown San Francisco office building has been sold for $111.3 million, marking one of the largest office sales since the pandemic. The office tower at 199 Fremont St., which is being rebranded as 300 Howard St., was sold to investors DivcoWest and Blackstone. This demonstrates the increasing appetite of investors in the area, which was emptied by remote work.
DivcoWest already held a 49% stake in the building in partnership with CalSTRS. Other previous owners included an AFL-CIO pension fund and Manova Partners. The 25-story, 420,000-square-foot building was sold for around $265 per square foot, which is significantly less than the approximately $900 per square foot that Divco and CalSTRS paid in 2020 for their previous stake. It is located next to Salesforce Park and was previously leased to Fitbit, now part of Google, and StubHub. Residential
Learn more here.
Housing
Affordability Pyramid
The National Association of Homebuilders has released its 2025 Priced-Out Analysis, highlighting the challenge of housing affordability. While previous posts discussed the effects of rising home prices and interest rates on affordability, this post focuses on the related U.S. housing affordability pyramid. The pyramid reveals that 70% of households (94 million) cannot afford a $400,000 home, while the estimated median price of a new home is approximately $460,000 in 2025.
The housing affordability pyramid illustrates the number of households able to purchase a home at various price points. Each step represents the number of households that can afford homes within a specific price range. The largest share of households falls within the first step, where homes are priced under $200,000. As home prices increase, fewer households can afford the next price level, with the highest-priced homes—those over $2 million—having the smallest number of potential buyers. Housing affordability remains a critical challenge for households with income at the lower end of the spectrum.

The pyramid is based on income thresholds and underwriting standards. Under these assumptions, the minimum income required to purchase a $200,000 home at a mortgage rate of 6.5% is $61,487. In 2025, approximately 52.87 million households in the U.S. are estimated to have incomes not exceeding that threshold and, therefore, can only afford to buy homes priced up to $200,000. These 52.87 million households form the bottom step of the pyramid. Of the remaining households that can afford a home priced at $200,000, 23.53 million can only pay a maximum price of between $200,000 and $300,000. These households constitute the second step on the pyramid. Each subsequent step narrows further, reflecting the shrinking number of households that can afford increasingly expensive homes.
Learn more here.
Tax incentives and housing growth
Property tax-based incentives like abatements and exemptions have been implemented in jurisdictions across the U.S. to promote housing development and preservation. In a study for the National Multi Housing Council, RCLCO’s Charlie Hewlett, Caroline Flax Ganz, and Jackson Browning examine how these programs support new construction and renovation projects by providing financial relief to developers, especially in those localities where market conditions make development a financial challenge.
Their analysis finds that, when structured effectively, these programs lead to a strong return on investment for municipalities, resulting in more affordable housing and increased tax revenues. Despite the clear benefits, some cities remain hesitant to adopt these incentives due to concerns about the timing and magnitude of budgetary impacts.
Key Findings
Tax-based programs help developers by filling financing gaps, especially in markets with affordability constraints. Municipalities benefit from new housing, new residents, and additional resident spending.
Evaluations across multiple U.S. cities show that these programs positively impact housing affordability by creating new deed-restricted affordable housing and indirectly by increasing the supply of market-rate housing.
In cities with affordable housing requirements, the programs often result in more affordable housing than the minimum required, highlighting the effectiveness of tax-based incentives in creating affordable housing options.
Download the report here.
Building an apartment in California is expensive!
It is probably no surprise that multi-family housing costs more to build in California than in Texas. But you might be surprised to learn that the cost per rentable square foot—the size of apartment units and common areas—is 2.3 times the average cost in Texas. This is the finding of a RAND Corporation report published in April 2025.
The report’s authors said California’s higher costs are due to a number of factors, including stricter zoning regulations and higher development fees, laws mandating higher wages for construction workers, and its earthquake and energy efficiency requirements. In the Bay Area is three times the Texas average for market-rate housing.
Learn more here.

Restrictive urban planning and housing affordability
Over the last half-century, increasingly restrictive urban planning policies have been linked to reduced housing affordability for the middle class. Given the significance of housing costs in household budgets, this also indicates that these restrictive policies, particularly urban containment, have been associated with heightened overall poverty. Some research even suggests that stringent regulation has taken a substantial toll on the economy.1
Unfortunately, much of the current housing affordability discussion profoundly misses what is probably the biggest issue — metropolitan area (market) restrictions on urban fringe development (the theological term is “urban sprawl”). Instead, we hear about smaller lot sizes (as if lot size matters much), parking (as if people will give up their cars and walk), historic preservation, and a host of minutiae that cannot hold a candle to the effect of blocking development in the one part of the market that defines the land value base for the entire enclosed area — the urban fringe.
Fundamentally, urban containment seeks to stop the expansion of urban areas (sprawl) and increase urban population densities. The international planning orthodoxy employs strategies such as greenbelts, urban growth boundaries, rural (large lot) zoning on urban peripheries, and compact city policies.
Generally, land values in the physical city (built-up urban area) increase toward the urban center and stronger commercial centers, all else being equal. As urban planning critic Wendell Cox explains, urban containment disrupts this pattern, causing abrupt land value spikes at urban growth boundaries and greenbelts, as well as higher land prices throughout the encircled area, including the inner city. This drives up land prices, which tend to become the most expensive factor of production where there is urban containment (Figure 1), as indicated in Vancouver and Toronto compared to Winnipeg.
Learn more here.

Source: Estimated from Altus and RBC
Largest modular housing project
One of the most ambitious and audacious attempts to solve California’s housing shortage is taking shape on a steep, grassy hillside overlooking California Polytechnic State University's sprawling 3,000-acre campus. There, on a former tiered parking lot, between eucalyptus trees and 1960s-era “red brick dorms,” a few dozen workers in yellow vests are digging out rocky soil, setting rebar, and pouring concrete footings in preparation for what is to be the largest modular housing project in the United States' history.
The $1.2 billion development will add 4,200 student housing units over the next five years, increasing the number of students housed on campus to approximately 12,200. The steel-framed “mods” will be assembled in a factory operated by the FullStack Modular company in Carson (Los Angeles County) and transported the 200 miles to San Luis Obispo, where they will be stacked in nine buildings ranging from seven to 12 stories in height.
The factory is just getting up and running: Components of the prefabricated steel “chassis” come flat-packed to the FullStack facility, where everything from kitchens and bathrooms to plumbing and electrical is assembled before drywall and paint are applied. The factory will produce between 10 and 15 mods a week, which arrive at the 3,000-acre Cal Poly SLO campus in the dead of night.
While the trustees approved $1 billion in financing for the housing, the phases will be paid for with bonds over the five-year construction period. That is where modular comes in. FullStack estimates that its modular system is approximately 25% cheaper and 30% faster than conventional construction. While the first building will likely cost more than $250,000 per unit, the hope is to get costs down to closer to $200,000 per unit in the future.
Learn more here.
Land banking for housing gains traction
Amid elevated interest rates, shifting consumer demand, and tighter capital from traditional banks, off-balance sheet land banking has emerged as a prominent strategy for home builders.
Many companies, particularly public builders, are pursuing land-light models, and land banking enables them to acquire and hold land for future construction. Land bankers act as capital partners, providing financing to acquire raw land, fund land development, and sell finished lots. Bill Southworth, founding principal of lot finance provider Builder Capital, notes that quicker timelines and repeatable deal structures are among the appealing elements of land banking for builders.
A bank loan may have a 50% or 60% advance rate, whereas land banking offers higher advance rates. Another compelling aspect for builders is that the counterparty has an option agreement to purchase lots, which is not a requirement. This arrangement is not treated as debt; it is regarded as off-balance sheet financing. This is advantageous for a builder firm aiming to manage its balance sheet.
The land-light model and off-balance sheet land banking enable public builders to achieve better valuations. Tim Sullivan, chief advisory officer for Zonda, states that land banking allows builders to allocate their capital elsewhere and remove land, perceived as risky and less favorable by Wall Street, from their balance sheet. Sullivan points to NVR—often considered the “poster child” for land-light models—as a prime example. With a stock price around $7,200, it far outpaces its public peers.
Under a typical land banking structure, the builder sources land for future development, securing zoning and entitlement. Before or upon closing of the land parcel, the builder and the land banking partner agree on a development budget and takedown schedule. The land banker retains title to the land until all finished lots are purchased. While it may take banks months to get a loan approved and reach the closing table, Southworth indicates that a land banking structure is more streamlined, allowing builders to reach the finish line in 30 to 45 days.
Learn more here.
Retail
The fate of malls is a mixed-bag
Some malls continue to thrive while others have fallen on hard times or even been razed to make way for new developments. Enclosed, indoor shopping malls have been on the decline for years, and those in the Phoenix metro area are no exception.
Some malls have survived by taking on new lives as entertainment and lifestyle hubs, and by tailoring themselves to fill specific niches.
With so much shopping done online these days, successful malls have evolved to play different roles in people's lives.
There's still a place for brick-and-mortar retail, but people are looking for food and entertainment while they browse. According to Donald Bredberg of Las Vegas-based StoneCreek Partners LLC, a shopping mall and retail consultancy, the big trend now is "location-based entertainment.” Businesses like PopStroke Golf, Chicken and Pickle Restaurant and Pickleball Court, and LumberjAxes ax-throwing bar are examples of tenants that have a strong customer draw.
Learn more here.
Master-planned communities
Central Park in Denver
When Denver’s Stapleton International Airport closed in the mid-1990s, community leaders saw a chance to create a new, 4,700-acre (1,900 ha) community just six miles east of downtown. The original developer, Forest City Stapleton (sold to Brookfield Properties in 2018), kicked off an urban transformation that is now nearing completion 25 years later. Known for extensive resilience strategies to reduce the effects of drought, flooding, and extreme heat, Central Park’s 12 neighborhoods are home to nearly 35,000 residents, with 60 parks as well as extensive pedestrian and bicycle trails.
A coalition of local civic leaders raised several million dollars to fund the creation of a master plan known as the Green Book. The plan was completed in the early 1990s in anticipation of the airport's closure in 1995. This plan, ahead of its time as the concept of “sustainable development” was still in its infancy, laid the foundation for and defined the ethos of the project.
The guidance provided by the plan has resulted in a diverse mix of housing types and price points, with affordable housing integrated throughout to ensure accessibility for residents of various socioeconomic backgrounds. Buildings are also highly energy-efficient, lowering residents' utility costs. The two town centers, each with an amphitheater, further foster neighborhood connections. “The MCA [Master Community Association] programs a lot of events.
Central Park has garnered international acclaim: a 2006 ULI Award for Excellence, a U.S. EPA Environmental Achievement Award, and the Stockholm Partnerships for Sustainable Cities Award from the King of Sweden. Nearing completion a quarter-century after its inception, Denver’s Central Park is a model for sustainable urban development that balances ecological restoration, community needs, and long-term resilience.
Learn more here.

Sustainability
Embodied carbon reduction case studies
This collection of embodied carbon reduction case studies prepared by the Carbon Leadership Forum (CLF) showcases projects across a wide range of building types, from office to high-rise residential to industrial facilities to university buildings to single-family residential homes. They implemented embodied carbon reduction strategies, including low-carbon concrete, mass timber, adaptive reuse, salvaged materials, innovative bio-based materials, and design for material efficiency.
CLF collaborated with these project teams to capture their design and decision-making processes, procurement successes and challenges, construction lessons learned, and what their team members took away from successfully reducing embodied carbon on their projects. Each case study includes the story, the details, including the development of a baseline, and the reported results compared to the design case.
The goal of this effort is to create a collection of project case studies that showcase how completed projects have assessed and reduced their embodied carbon, making it easier for building industry professionals to scale low-carbon design and construction practices. Being a ‘CLF Embodied Carbon case study’ is not part of a verification or certification process. These case studies focus on reduction strategies and are not intended to be used for benchmarking. To learn more about North American whole building life cycle assessment (WBLCA) building benchmarks, see CLF’s latest publications from the CLF WBLCA Benchmarking Study v2 or visit the public dataset (Benke et al. 2024, Benke et al 2025a).
Learn more here.
Regional and metropolitan trends
Metropolitan change in the USA
An analysis from GoodMigrations reveals which U.S. cities have changed the most in the last five years. The criteria include “population, income, jobs, home values, and new jobs created from new businesses over the past five years.”
The top five most changed cities are Boise City, Idaho; Provo, Utah; Lakeland, Florida; Austin, Texas; and Huntsville, Alabama. According to the article, “All the most-changed cities saw change in the form of rapid growth: increasing economic activity, elevating salaries, and gaining newcomers.” Austin had the highest population increase among cities with the strongest GDP, and added 25 percent more employed persons.
Eight of the top 10 cities were in the U.S. South. Four of the 10 least changed cities, meanwhile, are in Louisiana. “This seeming contradiction suggests that growth and prosperity in the South are not equally distributed, with some metros reaping the lion’s share of jobs, newcomers, and overall prosperity, leaving other cities in the region to stagnate at disproportionately high rates.”
Learn more here.

Immigration and metropolitan population change in the USA
Just a few months into office, the Trump administration has implemented a restrictive immigration policy while pursuing aggressive deportations. These anti-immigrant actions coincide with new Census Bureau data showing that the rise in immigration over the past few years, including both legal and undocumented immigrants, has bolstered population growth across the nation, particularly in large metro areas. The early 2020s severely impacted those areas’ populations, largely due to COVID-19, resulting in more deaths, fewer births, domestic out-migration, and reduced immigration from abroad. While most of these factors are now turning around, the new census data indicate that the recent increase in immigration is the primary reason why big urban area populations are now recovering.
These new numbers, detailing growth in the nation’s metro areas and counties through the middle of last year, follow those released earlier for the nation and states and incorporate updated immigration numbers. They indicate that the rise in immigration over the 2023-24 period drove national population growth to the largest level in two decades and accounted for most of the growth in 38 states.
The new data show that immigration is especially essential for the growth of the nation’s major metro areas (those with populations exceeding 1 million), as well as the cities and core counties within them. The data also reveal a softening of peak pandemic-era domestic migration patterns, with smaller out-migration flows from coastal and Midwest metro areas and reduced in-migration to “pandemic magnets” in the South and West.
Learn more here.
