Urban Sprawl Kills by H. Pike Oliver

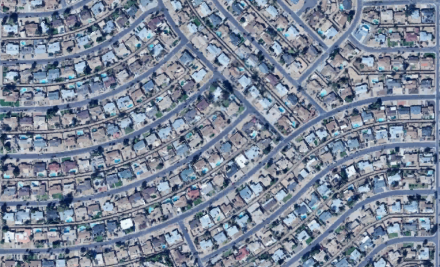
Screen Shot 2013-08-06 at 7.47.33 AM This is a creative and interesting video. But, the goal it advocates -- a population of a million on 40 square miles -- is unrealistic for most of the USA. The figure of 1 million people on 400 square miles cited at the beginning of the video works out to 2,500 persons per square mile, a little less than the 2010 average density of 41 major metropolitan areas in the USA. Reducing this million person metropolitan footprint to 40 square miles would require a dramatic increase in average density--to 25,000 per square mile. As of 2000, only about four percent of the USA lived in zip codes with a density of 25,000 per square mile or greater and 88 percent of those folks were in New York City. So, achieving the suggested 1 million people on 40 square miles is unlikely in much of the USA. Setting a more achievable target of, say, an average of 10,000 people per square mile would provide great environmental benefits and likely generate more support.

Koontz v. St. Johns River Water Management District Decision is Good for Planning by H. Pike Oliver

In a post at Atlantic Cities, Emily Badger opines that the decision of the U.S. Supreme Court handed down on June 26, 2013, in the case of Koontz v. St. Johns River Water Management District, will be a disaster for good planning. Contrary to what Ms. Badger has to say I believe that this decision is no disaster for good planning. In fact it reinforces it. Plans and associated regulatory programs should be fair and based on sound analysis. The nexus and proportionality tests provide for that. Planners and regulators will simply have to do their homework. As long as they impose costs fairly and proportionately, they can require that property owners and developers fund the analytical work

The Feasibility of High-Speed Rail -- Short Answer by H. Pike Oliver

Many young folks interested in improving connectivity between metropolitan regions wonder whether high-speed trains might be the answer.  Unfortunately, fast trains are unlikely to be the solution. Here is what I wrote to a student who asked about the feasibility of high-speed rail. High-speed rail may make sense in the northeast corridor of the USA, but not elsewhere. The challenge is having enough density of origins and destinations. You need both, just like with urban transit.

A good portion of this travel market is price sensitive. This is why the new, inexpensive, bus operators are seeing strong demand for medium distance inter-city travel.

Essentially, high-speed rail is a high-cost service that only a small percentage of the market can afford. You need a large higher density corridor for that relatively small niche that can afford it to amount to enough demand to make high-speed rail work.

High-Spped Rail Corridor Designations

A Slow Jobs Recovery Continues by H. Pike Oliver

The U.S. Government jobs report released on June 7, 2013, was relatively positive.  The domestic economy added an estimated 175,000 jobs in May 2013.  While the jobs report showed positive progress, it reflects a labor market that continues to be relatively weak as we approach the fourth anniversary of the formal end of the Great Recession--a period that I am beginning to think of as the Long Reset. Bill McBride of Calculated Risk updates the following chart every month.  It shows how we are progressing in the recovery from the Great Recession as compared to the ten other economic downturns we have experienced since the end of World War II.  This most recent job recovery is clearly the weakest experienced during more than fifty years.

2013-06-07 - Calculated Risk Job Recovery Chart

The Real Estate Cycle by H. Pike Oliver

This chart from RCLCo offers a concise summary of where real estate has been in the USA over the past few years--and where it might be headed. Of course, local market conditions and property specific circumstances can vary considerably.  The RCLCo outlook for 2013 is available here. 2012-01-17 - The Real Estate Cycle (RCLCo)

We Have Too Much Shopping Center Space by H. Pike Oliver

As of December 2012, the United States was three and a half years into a recovery from its worst economic downturn since the Great Depression. Yet many retail centers continue to experience difficulty attracting sustainable tenancies and we are seeing more and more vacant big box stores (RREEF - 2012).  The reason is that, overall, we have more retail space than we can sustain. A look at the change in shopping center space statistics over the past several decades shows that we have been on a building binge.  As of the mid 1980s, we had approximately 15 square feet GLA (gross leasable area) of formal shopping center space per capita (Serwer 2003). Since then, shopping center space (which accounts for about half of all retail space), has expanded four times faster than population growth.  By 2010, we had about 24 square feet of shopping center space for every man, woman and child in the United States (McKinsey - 2010)!

A strengthening economy is unlikely to absorb all of the excess shopping center space.  In fact, overall demand for retail stores is likely to shrink in coming years due to several factors:

  • slower growth in household incomes
  • a higher propensity to save due to continuing uncertainties about housing values and adequacy of retirement funding
  • migration of some retail sales to the Internet.

Several years ago, analysts at RREEF pointed out that even during the massive expansion of shopping centers between the early 1980s and the onset of the Great Recession, retail spending generally grew more slowly than gross domestic product (GDP) (RREEF 2009).  

Perhaps even more significant, retail spending has not been the major factor in the growth of the consumer sector. As the RREEF analysts point out, retail’s share of consumer outlays actually peaked more than sixty years ago--shortly after the end of World War II.  We tend to forget that the consumer sector also includes items such as rent, medical care and travel.  And the largest consumer growth category has been healthcare, which increased from only 3% in 1945 to almost 18% of household expenditures in 2008 (RREEF 2009. p. 4).  So far, there is no evidence that this long-term rise in healthcare expenditures will abate.

More than any other factor, population growth will support the absorption of space in retail centers.  As of 2012, the US Bureau of the Census bureau forecast the population of the United States to grow from about 315 million at the beginning of 2013 to 400 million in 2051—an increase of 33% over this 48-year period (U.S. Bureau of the Census 2012).  If we added no more shopping center space, this population growth would bring the amount space down to a more sustainable ratio—about 17 square feet per capita—two square feet above where we were as of the mid 1980s.

But not all regions of the nation will grow equally. And the regions that have grown most rapidly tend to be those that have seen outsized growth in retail space.  The simple fact is that under any economic and demographic scenario we have more shopping center space than we need.

References

Homebuilder confidence and GDP by H. Pike Oliver

Joe Wiesenthal reported on November 19, 2012, at Business Insider  that the big economic datapoint of the day is homebuilder sentiment. This National Association of Homebuilders (NAHB) index is at its highest level since 2006. The chart below compares the NAHB Hombebuilder Sentiment index with the share of gross development product (GDP) attributed residential construction (with a 12-month lag). This surge in positive sentiment could foreshadow a significant increase in economic activity n the USA.


Real estate cap rates in the USA - October 2012 by H. Pike Oliver

Steve Felix is a weekly blogger on institutional real estate and other topics.  He has a knack for finding and distilling important information.  On November 30, 2012, he posted information on real estate capitalization rates that he gleaned from a recent report prepared by the folks at Real Capital Analytics.  Here is what he had to say:

  • Hotels:  Nationwide, cap rates for hotels have remained relatively flat in 2012 at an average of 7.7%.
  • Apartments:  The capital shift to higher yielding markets has caused national cap rates to rise in the mid/high-rise sector, although average yields for garden properties have held firm and changed little over the past six months.
  • Retail:  While average cap rates on strip centers have fallen to 7.6% nationally, properties with the right anchor and location can command well below that.
  • Industrial:  Nationally cap rates continue to witness compression and, at an average of 7.6%, have reached lows not seen since late 2008.
  • Office:  Average cap rates nationally, on CBD (Central Business District) acquisitions, have risen since Q1'12 with fewer trophy sales to pull down the average and more secondary market sales that push the average up.