
ARES Urbanexus Update #180
The American Real Estate Society (ARES) distributes real estate and community development updates curated by H. Pike Oliver, FAICP.
The economy and real estate
Implications of the K-shaped economy
The K-shaped economy refers to the two-tier demand structure that rewards precision in product positioning but introduces a more fragile growth foundation than headline figures suggest. With the top 20 percent of earners responsible for a substantial share of consumer spending, asset classes catering to affluent households are performing better.
The positive aspects of uneven economic growth for the real estate sector are improved performance in sectors such as luxury and experiential retail, resort hotels, data centers, and even self-storage. Perhaps the greatest beneficiary has been the residential sector, where pricing increased substantially. While the gains were positive, this is also an area to watch as the underlying demand for housing remains high, yet affordability is an issue. Housing may be the canary in the coal mine.
A scenario of a “missing middle” in retail is possible and likely if the K-shaped situation remains. In this scenario, luxury shopping centers and, more generally, centers in higher-income locations will show more resilience than their middle-income counterparts. Paradoxically, lower-middle-income- and lower-income-focused retailers and centers may benefit as cash-strapped households trade down. This is especially true for groceries and grocery-anchored centers.
For developers, investors, and lenders, the central risk is one of concentration. An economy reliant on wealth effects from equities and real estate to sustain consumption is inherently vulnerable to asset price corrections. A meaningful pullback in markets could rapidly erode the very spending that is propping up the upper arm of the K, with cascading effects on property-level cash flows and credit performance. The industry should be stress-testing portfolios not only for interest rate scenarios but also for a reversion in household wealth, the engine that is currently masking broader fragility in demand.
Learn more here.
Master-planned communities
The Irvine Ranch in Southern California
Six and a half decades of master-planned development on the Irvine Ranch in Southern California is the subject of two books co-authored by C. Michael Stockstill and H. Pike Oliver and published by Routledge of the Taylor and Francis Group: Transforming the Irvine Ranch: Joan Irvine, William Pereira, Ray Watson and the Big Plan, (June 22, 2022), and The Irvine Ranch: Fulfilling the Vision, 1977-2025 (May 14, 2026)

This is the story of how a 93,000-acre landholding evolved from an agricultural empire into one of the world’s most ambitious and successful master‑planned developments. Despite all the development, 62% of the land (57,500 acres) is devoted to natural preserves and large parks.
The books provide an in-depth insider look at the planning and real estate strategies that shaped development and land preservation. Approximately 500,000 people now reside on the ranch, along with several hundred thousand jobs and the University of California at Irvine, a 37,000-student Tier 1 research university.
The first book traces the origins of the planning framework, detailing the pivotal decisions that established its long‑term structure and fostered initial implementation from 1960 to 1977. The second volume examines nearly five more decades of implementation, adaptation, and stewardship under changing economic, demographic, and regulatory conditions.
Across both works, a consistent theme emerges: the Irvine Ranch is not merely a large master‑planned community but a region‑shaping mega project whose scale, governance continuity, institutional depth, and environmental commitments have no true global parallel.
The books are included in the Real Estate Thought Leadership Collection offered by the American Real Estate Society.
Learn more about the first book here and the second book here.

Location of the Irvine Ranch within the greater Los Angeles metropolitan area
Breweries and beer gardens help create community
Master-planned communities are increasingly using breweries, beer gardens, and similar “third places” as intentional placemaking tools that strengthen social connection and reinforce community identity. Developers argue that these hubs deliver both financial returns and “social ROI,” offering the everyday interactions and sense of belonging that many Americans—especially younger buyers—now prioritize. Data from the America at Home Study support this shift: nearly one‑third of respondents, and an even higher share of Millennials, say that a community hub with a microbrewery and social amenities would influence their homebuying decisions. Even as alcohol consumption declines, these spaces remain valued as walkable, low‑pressure gathering spots.
Red Oak Development Group has embraced this approach through what it calls “cultural living rooms.” In its 2,500‑home Moxie community in Lockhart, Texas, the brewery will anchor The Crossing, a walkable town center designed for all‑day use—from morning coffee to evening gatherings. The design emphasizes indoor–outdoor flow, shaded patios, flexible seating, performance space, and acoustic strategies that preserve the quiet of nearby residential areas. The brewery is conceived not as a novelty but as a natural extension of Moxie’s emphasis on porches, parks, trails, and spontaneous encounters.
Somers West is pursuing a similar strategy at Braden, its 2,667‑acre master plan in Sacramento. There, a brewery will sit at the heart of the retail village, reflecting both the cultural appeal of craft beverages and a deliberate move away from sterile, car‑dependent master plans. The goal is to create an immediate, authentic gathering place that supports Braden’s broader food, beverage, and entertainment offerings and strengthens its sense of place.
Both developers also view breweries as platforms for programming and partnerships that deepen community life. At Moxie, Red Oak collaborates with local chefs, pitmasters, artists, and schools, as well as with seasonal festivals and events tied to its TEACH initiative, which supports local educators. Braden’s brewery will host farmers markets, game nights, fundraisers, and resident‑focused gatherings. These activities reinforce the brewery’s role as a social magnet—an amenity that signals a community designed for living, not merely for housing.
Together, these examples illustrate a broader shift in master-planned development: social infrastructure is becoming as essential as physical infrastructure. When thoughtfully integrated, breweries and beer gardens act as catalysts for belonging, identity, and everyday joy, helping large-scale communities feel connected, grounded, and genuinely lived‑in.
Learn more here.
Residential
Long-term forces shape housing demand in the U.S.
Via Eye on Housing, Rose Quint reports that home builders are keenly aware of the complex long-term outlook for the homebuilding industry. A recent NAHB/Wells Fargo HMI survey asked builders to assess the impact of 14 major trends and forces on the health of the industry and housing demand over the next 10 years. Results show that home builders expect a mix of demographic, economic, and technological forces to exert significant, long-term influence on the industry.
At one end, most builders consider five forces as high or somewhat negative long-term risks to the industry and housing demand:
Government debt levels: 82%
Declining fertility rate: 78%
Long-term inflation outlook: 70%
Declining marriage rate: 67%
Energy costs: 61%
At the same time, builders identified several forces they expect to have a strong or somewhat positive impact on the health of the home building industry and housing demand over the next decade, led by structural and technological shifts:
Aging housing stock: 73%
Work-from-home trends: 65%
Artificial intelligence: 52%
Modular and panelized construction: 45%
These findings reveal that while long-term demographic trends and fiscal pressures are considered serious headwinds, builders also see meaningful opportunities to adapt related to an aging housing stock, evolving work patterns, and artificial intelligence. For additional details and results, please consult the full survey report.
Learn more here.
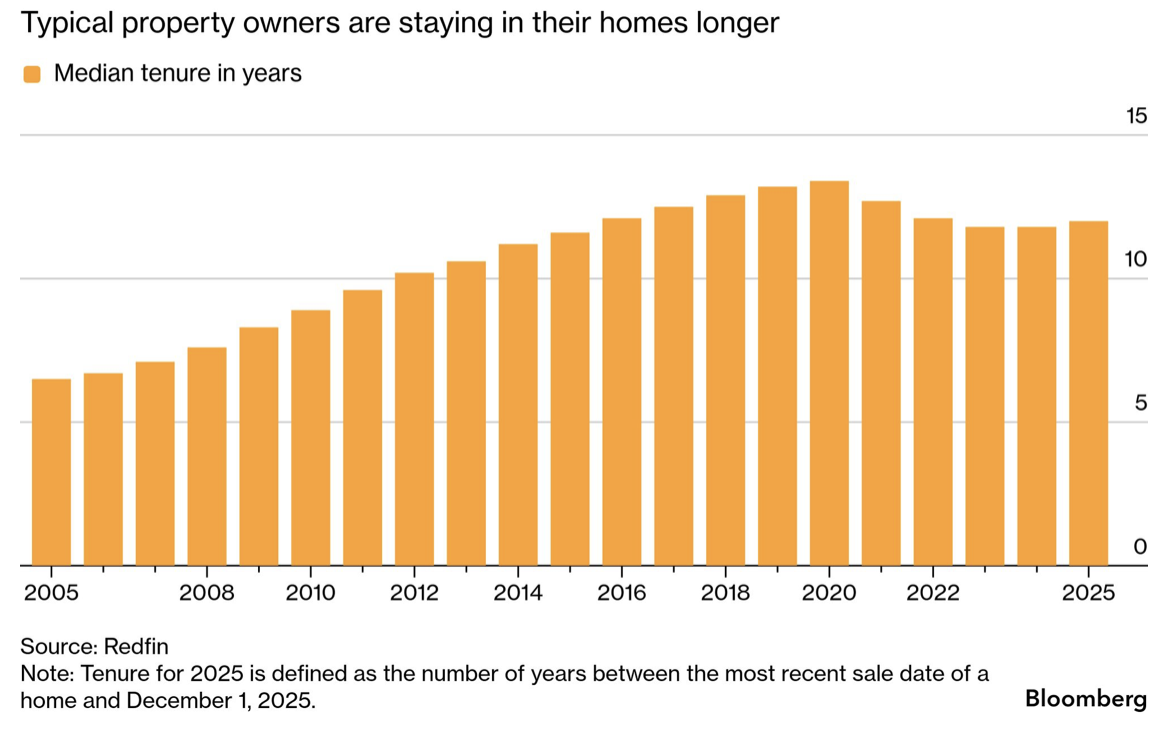
American homeowners are slow to move
The typical US homeowner has stayed in their home for 12 years, almost double the median tenure from two decades ago, according to Redfin. That grip on the housing stock is helping keep home prices high and out of reach for many.
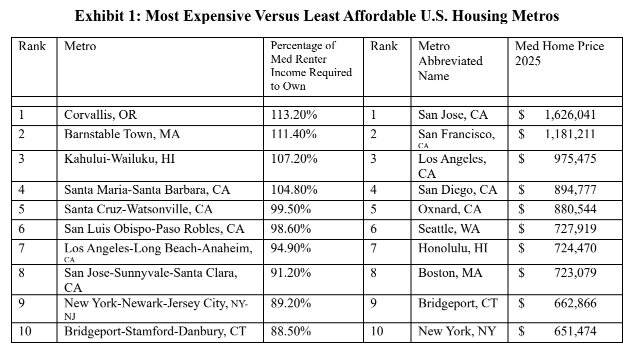
A more realistic housing affordability measure
Ian Kennedy and Norman G. Miller, PhD of the Burham-Moores Center for Real Estate in the Knauss School of Business at the University of San Diego, are proposing a new housing affordability index based on median renter income, median home prices, and including debt service, property taxes, property insurance, and all utilities typically required for home ownership. When using this measure, the rankings of least and most affordable markets shift as compared to a price-dominated ranking.
Below, in Exhibit 1 from their draft paper, they summarize the top 10 least affordable housing markets based on price, the top 10 least affordable based on actual housing costs, and the top 10 least affordable using renter median incomes. San Francisco, not shown, would rank 11th on the basis of affordability with their new measure. The reason is that incomes in San Francisco are considerably higher than in most other US metros. This brings up the point that the economic base and types of jobs within a metro matter a great deal.
Make it stand out
Affordable housing for school teachers
Anna Merod reports via SMARTCITIESDIVE that as some teachers struggle to afford housing in their school communities, a growing number of districts are taking the matter into their own hands by offering affordable housing for their staff.
An analysis published last year by the National Council on Teacher Quality found that nationwide housing costs rose on average 47% to 51% between 2019 and 2025, while average beginning teacher salaries grew at a much slower rate — 24%.
School districts are turning to subsidized housing as a response to the widening gap between teacher pay and rapidly rising housing costs. Examples like Bentonville, Arkansas, show how partnerships with affordable‑housing developers can produce below‑market rentals and even rent‑to‑save programs that help educators accumulate funds for a future home purchase. Other districts, such as Austin ISD, are repurposing their own land for large mixed‑income developments that prioritize teachers while avoiding direct construction costs through long‑term land leases.
Financing these projects typically requires a mix of rental income, voter‑approved bonds, federal and state affordable‑housing programs such as Low‑Income Housing Tax Credits, and partnerships with nonprofit or for‑profit developers. Some districts also use green‑energy incentives or convert closed school sites into housing. Despite these tools, projects often face funding gaps and long development timelines, and eligibility rules tied to tax credits can limit who can live in the units.
Whether these initiatives improve teacher recruitment and retention remains difficult to measure. While surveys suggest educators value housing support, evidence of long‑term impact is limited, and districts are encouraged to set clear goals and align housing projects with broader educational and facility needs.
Learn more here.
Recommendations for a U.S. housing affordability strategy
A national housing affordability strategy, as outlined by the Urban Institute, begins with the recognition that housing costs have become the largest and most destabilizing expense for most American households. Rising rents and home prices now outpace incomes across much of the country, making affordability the top financial concern for voters under 65. The federal government already plays a massive role in the housing system—spending hundreds of billions annually and supporting tens of millions of households—yet today’s crisis requires a more coordinated, long‑term approach that aligns federal leadership with state and local action.
The first principle is to align supply‑side investments with demand‑side support. Severe shortages of affordable homes remain a primary driver of high costs, but increasing supply alone cannot reach the lowest‑income households. Because new housing takes years to deliver and rarely serves the poorest renters without subsidy, a national strategy must simultaneously expand production—by lowering construction, financing, and regulatory costs—and strengthen households’ ability to afford housing through targeted assistance. This dual approach ensures that renters, homebuyers, and people experiencing homelessness all benefit from a more balanced system.
The second principle is to deploy the full federal toolkit. Congress has a wide range of levers that can accelerate production and reduce long‑term costs, including incentives for pro‑housing localities, tariff exemptions for building materials, and programs that expand or preserve the supply of affordable units. A comprehensive strategy would use these tools to unlock production capacity across all housing types—new construction, rehabilitation, and preservation—while addressing the cost drivers embedded in land, labor, materials, and regulation.
The third principle, implied across the Urban Institute’s framing, is that federal action must be sustained and coordinated, not episodic. Past crises have shown that large‑scale federal interventions can stabilize housing markets and expand opportunity, but lasting progress requires ongoing partnership with state and local governments. Because affordability challenges vary widely across regions, federal leadership must set the direction and provide resources, while localities adapt solutions to their specific market conditions.
Taken together, these principles call for a national strategy that is comprehensive, long‑term, and grounded in both production and affordability. They also highlight a central tension: solving the crisis requires not just more housing, but a more coherent system that aligns federal investment, local land‑use decisions, and household‑level support.
Learn more here.
Build to rent as an affordability solution
Build‑to‑rent (BTR) has emerged as a crucial response to the widening affordability gap in U.S. housing, particularly as the for‑sale market stalled in 2025 amid weak consumer confidence, high costs, and economic uncertainty. As the sector matures, BTR has evolved into a diverse ecosystem rather than a single product type. It now spans townhomes, cottage‑style villas, horizontal apartments, and purpose‑built single‑family rentals.
Operating models vary widely as well, from builder‑backed platforms like Taylor Morrison’s Yardly, to REITs such as VineBrook Homes, to fully integrated developers like Middleburg Communities. This diversification reflects a shift from the rapid expansion of 2020–2022 to a more disciplined, stabilized phase in which BTR is treated as a distinct sub‑asset class. Developers note that the sector barely existed a decade ago, yet it now occupies a central place in conversations about attainable housing.
BTR’s appeal lies in its ability to deliver the kinds of “missing middle” homes—duplexes, townhomes, small‑lot detached units—that many households want but cannot afford to buy. In a high‑interest‑rate environment, BTR communities are often easier to finance and build than for‑sale projects, enabling more housing to reach the market despite capital constraints.
For renters, these neighborhoods offer space, privacy, and a suburban feel without the barriers to homeownership. At the same time, the model raises questions about long‑term wealth‑building, since most BTR communities are institutionally owned and held as rental assets. Some housing advocates argue that closing the affordability gap may require a broader mix of tenure types, not just more rental supply.
Taken together, the article frames BTR as the “new missing middle”: a flexible, scalable housing type that can expand supply in a constrained market, even if it does not replace the wealth‑building benefits of ownership. Its continued growth will depend on how financing systems, zoning, and policy frameworks adapt to support smaller‑scale, neighborhood‑oriented housing that meets the needs of households priced out of traditional homeownership.
Learn more here.
Asian immigrants, educational quality, and housing prices in the USA
At the county level, the rise in housing prices is due, in part, to a positive impact on K-12 education. Asian immigrants are both the fastest-growing and highest-earning immigrant ethnic group in the United States, facts that have caught the attention of economists interested in how these groups — whether investors or residents — impact housing prices, K-12 education, and other important aspects of community life.
A study by economists at MIT and the University of Cincinnati, published in the May 2026 issue of the Journal of Urban Economics, examines this trend, focusing on potential mechanisms linking rising home prices to subsequent improvements in education at the county level. Their findings suggest that home prices rise not simply because of increased demand, but because new neighbors positively influence the quality of K-12 education, which in turn increases desirability.
While county data is not granulated to the neighborhood or even municipality level, the researchers found that 30 to 40 percent of the rise in home values purchased in areas where Asian immigrant buyers have school-age children correlates with improved quality of education, as indicated by the average rise in standardized test scores of all children in the county.
Learn more here and obtain the Journal of Urban Economics article here.
A unique residential “holdout” in New York City
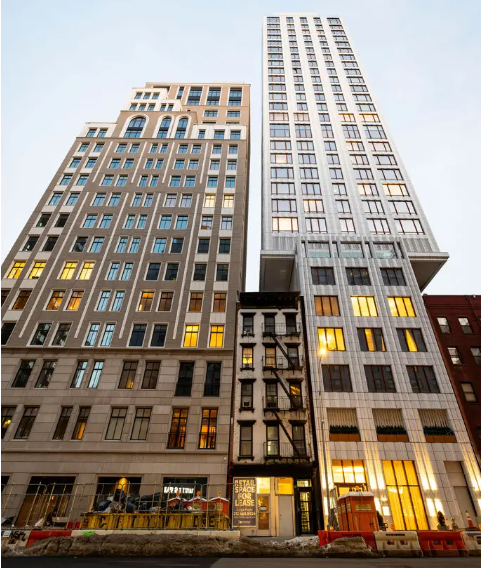
1301 Third Avenue in Manhattan is sandwiched between an 18-story luxury condominium and a 32-story tower. Credit: Katherine Marks for The New York Times
An early 20th‑century tenement building at 1301 Third Avenue in Manhattan stands out because it is a modern holdout shaped by today’s regulatory environment rather than owner obstinacy. Most classic New York holdouts—like the Rockefeller Center brownstones, the carved‑out notch at 127 John Street, or the preserved bar at P.J. Clarke’s—were driven by personality, brinkmanship, or sentimental attachment. In contrast, the Third Avenue case is the product of rent regulation, acquisition limits, and the economics of ultra‑luxury development.
Engineering complexity also sets it apart. While earlier holdouts required creative steelwork or façade notches, few involved two towers rising simultaneously around a single occupied building, with construction tolerances measured in inches. The visual contrast is similarly sharper: a five‑story walk‑up pinched between glass towers is more extreme than the mid‑rise juxtapositions typical of earlier eras.
Finally, the market logic differs. Developers today can justify expensive workarounds because a single condo sale can offset millions in engineering costs. That dynamic makes the Third Avenue holdout less a story of defiance and more a case study in how contemporary zoning, tenant protections, and luxury pricing intersect to produce a 21st‑century version of a very old New York phenomenon.
Learn more here.
Industrial
Data centers
The North American data center market absorbed 15.6 gigawatts (GW) in 2025, twice the amount of 2024. Among all planned North American data center development venues, Northern Virginia leads with 5.9 GW, followed by Phoenix (4.2 GW), Dallas-Fort Worth (3.9 GW), and Las Vegas/Reno (3.5 GW).
The construction pipeline has also ballooned to 7.8 GW, approximately 10 times the volume from five years ago. Phoenix (1.3 GW) leads construction activity, followed by Chicago (1.18 GW), Atlanta (1.11 GW), and Northern Virginia (1.06 GW).
Preleasing represents 73% of all North American data center capacity under construction. High preleasing has remained consistent for the past two years, signaling that meaningful market relief remains years away.
The data center sector continues to solidify its position as one of the most favored real estate asset classes, with a 161% increase in market capitalization since 2019. This remarkable growth is driven by insatiable tenant demand, limited supply, and rising rents, creating a compelling investment thesis that continues to attract new capital to the sector.
The debt markets for data centers are experiencing significant expansion, with asset-backed security (ABS) and single-asset single-borrower (SASB) loan activity increasing for the third consecutive year. The first half of 2025 saw 14 ABS deals totaling $7.7 billion and four SASB deals totaling $5.7 billion, substantial increases from the same period in 2024. Meanwhile, asset-level investment sales remained relatively muted at $754 million across 23 transactions in H1 2025, with average cap rates holding steady around 6%, comparable to premium industrial and multi-housing properties.
Retail
Eddie Bauer’s final unraveling
The collapse of Eddie Bauer in early 2026 marks the end of one of North America’s most recognizable outdoor‑apparel retailers. After decades of declining sales, shifting consumer behavior, and mounting operational pressures, the company’s North American retail operator filed for Chapter 11 bankruptcy in February 2026.¹ The filing represented the brand’s third bankruptcy in just over twenty years—an unmistakable sign of long‑term structural weakness rather than a temporary downturn. At the time of the filing, Eddie Bauer operated roughly 180 stores across the United States and Canada, a steep fall from its peak of nearly 600 locations in 2001.¹
The bankruptcy process quickly revealed the depth of the company’s distress. Catalyst Brands—the parent company overseeing Eddie Bauer’s retail operations—had acquired the chain only a year earlier, in January 2025, but acknowledged that the brand’s challenges had worsened since the acquisition.² Persistent inflation, supply‑chain disruptions, tariff uncertainty, and reduced discretionary spending on outdoor apparel all contributed to a retail environment in which Eddie Bauer could no longer compete effectively.² These pressures compounded the long‑running shift toward e‑commerce, which has steadily eroded the viability of traditional mall‑based apparel chains.
By early March 2026, the situation had deteriorated to the point that Eddie Bauer’s real‑estate advisor, RCS Real Estate Advisors, began marketing 174 store leases for closure across North America.¹ Fast Company reported that all 175 remaining stores were expected to close in the coming weeks, with liquidation sales projected to conclude by May 2026 unless a last‑minute buyer emerged.² A planned bankruptcy auction subsequently failed due to lack of interest, confirming that no viable buyer was willing to take on the brand’s retail footprint.³ With the auction canceled, Eddie Bauer’s wind‑down became inevitable.
The shutdown of Eddie Bauer is emblematic of the broader “retail apocalypse” that has reshaped the American retail landscape over the past decade.² Once‑dominant mall brands—from Party City to Joann to Saks Off 5th—have faced similar pressures as consumers shift toward online shopping and as brick‑and‑mortar costs rise. Eddie Bauer’s closure is particularly symbolic, given its century‑long history and deep roots in the Pacific Northwest. Founded in Seattle in 1920 as a fishing shop, the company helped popularize down jackets and outfitted generations of outdoor enthusiasts.⁴ Its disappearance from physical retail underscores how even storied brands are not immune to the structural forces reshaping the industry.
Sources:
National Day Today. “Eddie Bauer Closing Over 170 Stores Amid Bankruptcy.” National Day Today, March 8, 2026. https://nationaltoday.com/news/eddie-bauer-closing-over-170-stores-amid-bankruptcy/
Snelling, Grace. “Eddie Bauer Plans to Close All U.S. and Canada Stores in Bankruptcy. See the Full List of Doomed Locations.” Fast Company, February 9, 2026. https://www.fastcompany.com/91012345/eddie-bauer-closing-stores-full-list-bankruptcy-liquidation
mlive. “Eddie Bauer to Close All Stores After Bankruptcy Auction Fails.” mlive, 2026. https://www.mlive.com/business/2026/03/eddie-bauer-to-close-all-stores-after-bankruptcy-auction-fails.html
James R. Warren, “Bauer, Eddie (1899–1986),” HistoryLink Essay 1671, September 16, 1999, https://www.historylink.org/File/1671.
Mixed-use
Can fake downtowns grow organically?
In an article posted on his Substack, The Future of Where, Bill Fulton, FAICP, examines whether the “fake downtowns” created by private developers—often on the sites of aging malls or as master‑planned lifestyle centers—can ever evolve into places that feel genuinely authentic. He begins with the juxtaposition of Los Angeles’ Original Farmers Market and The Grove. Though both are owned and curated by the same long‑standing landowner, the Farmers Market feels organic while The Grove feels manufactured. Fulton notes, however, that even the Farmers Market is not truly organic; it, too, is a curated commercial environment. This raises his central question: can today’s highly managed, privately owned town‑center developments eventually acquire the patina of authenticity that older downtowns possess?
Fulton argues that authenticity in traditional downtowns stems from fragmented ownership, incremental change, and the presence of quirky, low‑rent, small‑scale uses—conditions that are difficult to replicate in master‑planned environments. Fake downtowns, by contrast, are typically controlled by a single owner who must monetize every square foot, leaving little room for the serendipity, experimentation, and non‑commercial uses that give older districts their character. Yet he also observes that these new centers often outperform struggling historic downtowns in management, maintenance, and safety, highlighting a paradox: the very qualities that make them successful also make them feel artificial.
He sees promise, however, in the gradual evolution of regional malls. Rather than being demolished and replaced wholesale, many malls are transitioning into hybrid environments where legacy retail coexists with new uses such as housing, gyms, and entertainment. Fulton’s visit to Parkway Plaza in El Cajon illustrates this point: while parts of the mall are tired, the center is far from dead and is slowly transforming. Over time, he suggests, the inline storefronts of such malls could become the quirky “Main Streets” of tomorrow, especially as owners diversify revenue streams and loosen their grip on uniformity.
Fulton concludes that if suburban communities want walkable town centers that feel authentic, they must allow these places to evolve rather than remain rigidly curated. Authenticity, he argues, is not something that can be manufactured at the outset; it emerges through time, adaptation, and a tolerance for uses that may not maximize short‑term revenue. His piece invites planners, developers, and cities to consider how governance, ownership patterns, and incremental change can help today’s manufactured places mature into tomorrow’s beloved districts.
Learn more here.
A long path to the redevelopment of a horse racetrack
The transformation of a fading horse racetrack 22 miles south of downtown San Francisco into one of the Bay Area’s most prominent transit‑oriented redevelopments began 18 years ago and is now approaching full build‑out. After years of declining attendance, the 83‑acre site was reimagined by Wilson Meany and Stockbridge Capital Group as a dense, mixed‑use district directly atop a Caltrain station—an early, ambitious example of New Urbanist, infill development. The plan called for 5 million square feet of housing, offices, and open space, replacing the aging grandstands with a walkable neighborhood organized around plazas, parks, and a central town square.
The path to realization was long and contentious. Although the racetrack closed in 2008, the entitlement process had already been slowed for years by lawsuits and appeals from neighbors opposed to density, who warned the project would create “a new Manhattan.” Developers ultimately reduced building heights from nine stories to five, even though the taller structures would have matched the racetrack’s original scale. Those delays pushed the project into the Great Recession, but the long-term vision held. By the mid‑2010s, construction accelerated, and the district began to take shape as a model for large-scale Peninsula redevelopment.
Today, Bay Meadows is nearly complete and widely regarded as a success. Its 1,100 housing units are almost fully occupied, the 40,000 square feet of retail is fully leased, and its office space—anchored by Roblox, which has now committed to the final two commercial parcels—is effectively spoken for. The neighborhood’s parks, playgrounds, community garden, and 12-acre open space have become daily gathering places for residents, office workers, and Caltrain commuters. Local businesses, from Fieldwork Brewing to Bahche Mezzehouse, describe a steady flow of families, tech workers, and visitors, creating a lively environment that contrasts sharply with the isolated corporate campuses that once dominated the Peninsula.
The project’s influence extends beyond San Mateo. Stockbridge and Wilson Meany have applied similar principles to Hollywood Park in Inglewood—now home to SoFi Stadium—and to the ongoing redevelopment of Treasure Island and Yerba Buena Island in San Francisco. For the developers, Bay Meadows proved that large, walkable, transit‑served districts can thrive in California’s core urban regions. Its success continues to shape how the region approaches infill development, offering a template for future mixed‑use neighborhoods built around transit, public space, and a blend of residential and commercial life.
Learn more here.
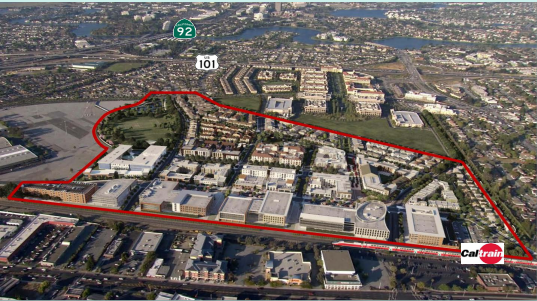
Source: Wilson Meany
Transportation and transit
Regional and metropolitan trends
Major U.S. metropolitan area growth slows as immigration falls
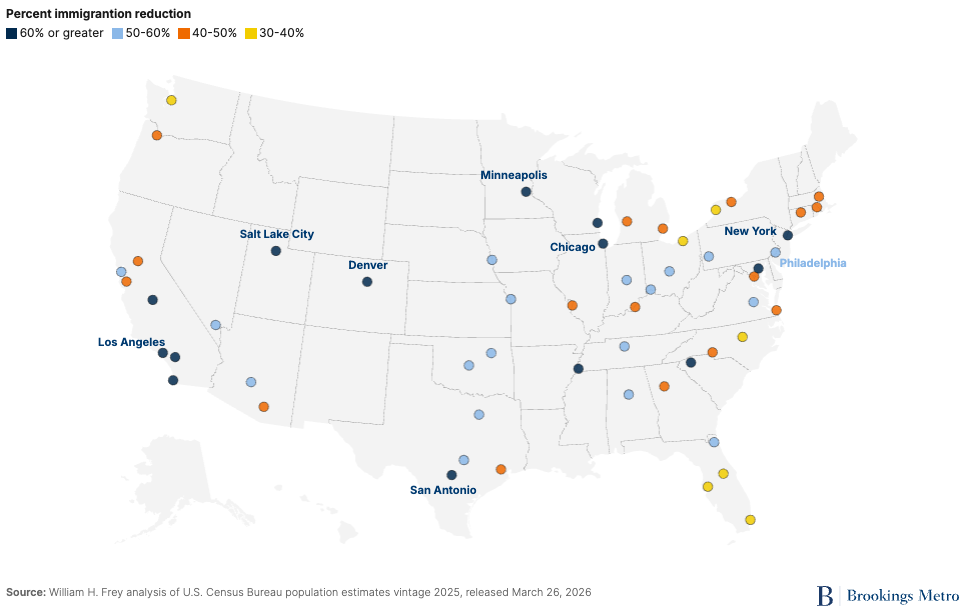
Percent decline in international migration between 2023-24 and 2024-25
A Brookings report reveals that the sharp decline in immigration between 2023–24 and 2024–25 produced a widespread slowdown in population growth across all 56 major U.S. metropolitan areas. Immigration had rebounded after the pandemic and was the primary driver of renewed metro growth in 2021–24. But in the most recent year, new immigrant arrivals fell by more than half—from 2.06 million to 969,000—due largely to restrictive federal policies. Because major metros historically receive more than 75% of all immigrants, this contraction had an outsized demographic impact. Nearly every large metro experienced slower growth, a shift from growth to decline, or deeper population losses.
The article highlights that the largest metros—New York, Los Angeles, Chicago, Miami, Houston, and Dallas—saw especially steep drops in immigration, often exceeding 50–60%. New York’s population gain fell from 291,111 to just 32,361 in one year, while Los Angeles shifted from modest growth to a loss of more than 62,000 residents. In 31 major metros, the decline in immigration alone fully accounted for the slowdown in population growth; in another 22, it explained most of the change. Domestic migration patterns also mattered, but the dominant factor in the most recent year was the collapse in international inflows.
The Census Bureau projects immigration could fall even further, to roughly 321,000 for the year ending June 2026. If sustained, such reductions would push the U.S. toward very low or negative population growth and a shrinking working‑age population. Brookings emphasizes that metro areas with rising foreign‑born shares have historically shown stronger economic performance, and that continued declines in immigration would pose serious long‑term risks to urban labor markets, productivity, and economic vitality.
Learn more here.
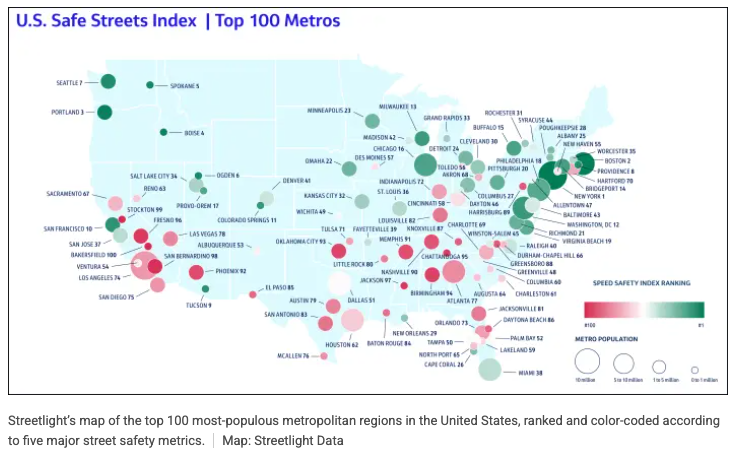
Best and worse U.S. cities for street safety
Make it stand out
Whatever it is, the way you tell your story online can make all the difference.
The U.S. Safe Streets Index published by the transportation analytics firm StreetLight found Sunbelt cities in the South and Southwest to have some of the worst road safety, reports J.K. Trotter in Streetsblog USA.
The analysis notes that, in most of the cities at the bottom of the list, “Vehicle miles traveled exposure tends to be high, and there is also heavy speed risk on pedestrian heavy roadways, which may be linked to wider arterials and higher-speed corridors.” It also points out that the safest cities, with some exceptions, tend to be some of the oldest, whose street networks were developed before the rise of the automobile and car-centric planning.
Ultimately, “Northern coastal metros may perform better in the Safe Streets Index due to their density and transit-oriented infrastructure, which helps limit miles driven, the highest-weighted factor in the analysis.” Dense cities reduce risk by simply lowering driving exposure.
Cities vary across the five metrics used by StreetLight for the analysis. “Streetlight ranked Los Angeles 96th out of 100 in terms of speed differential risk. But it also ranked L.A. fifth out of 100 for residential speeds.” Portland, Oregon ranks close to the top overall, but falls outside the top third for truck activity per capita.
Learn more here.
Public sector real estate
Federal facilities maintenance backlog
Decades of chronic underfunding have left the federal government with an estimated $50 billion backlog of deferred maintenance across buildings managed by the General Services Administration (GSA). According to the Public Buildings Reform Board’s (PBRB) interim report, GSA has long received only 0.375% of its portfolio’s replacement value for maintenance—far below the 2–4% industry standard—accelerating deterioration, raising lifecycle costs, and weakening facility performance. The report warns that without major policy changes and a reduction in the federal real estate footprint, this liability will continue to grow.
The PBRB’s analysis shows that buildings 31 to 75 years old represent the largest share of GSA’s square footage and carry the highest maintenance costs per square foot, diverting limited resources from newer, more viable assets. As buildings deteriorate, agencies are often forced to relocate employees to leased space, leaving taxpayers to pay for both new leases and the upkeep of vacant federal properties. The board argues that Congress cannot “appropriate its way out” of the problem and instead calls for a radical reduction in portfolio size, including potential sales, consolidations, and redevelopment opportunities.
The report characterizes the maintenance crisis as both a financial and operational risk: deteriorating buildings hinder agencies’ ability to fulfill their missions and depress surrounding property values in local communities. The PBRB concludes that only structural reforms—such as aligning capital planning, increasing flexibility in the Federal Buildings Fund, and leveraging private capital—can stabilize the portfolio. Without such action, the federal government’s deferred maintenance liability is expected to escalate dramatically in the coming years.
Learn more here.