ARES Urbanexus Update #181
The American Real Estate Society (ARES) distributes real estate and community development updates curated by H. Pike Oliver, FAICP.
Climate change
Bad news and good news
The bad news is that climate change is accelerating. July was the warmest month on record in the contiguous United States, according to the National Oceanic and Atmospheric Administration. We are also discovering new ways the climate system is more fragile and more sensitive to emissions.
The good news is that green (non-fossil fuel) energy is getting better and cheaper. In April, the energy think tank Ember released a report finding that all new electricity demand worldwide in 2025 was met with green power.
A recent conversation between Ezra Klein of The New York Times and Bill McKibben of Middlebury College offers perspective on how advances in green technology could foster a new climate policy approach. This would be one that doesn’t just talk about sacrifice and disaster prevention. It would present decarbonization and green energy as a stepping stone to a future of more and better—not less and worse.
Learn more here.
Metropolitan trends
Rising college attainment reshapes housing demand
Across the U.S., the share of adults 25-plus with a bachelor’s degree or higher has steadily climbed, reflecting broader national trends in educational attainment. At the metro level, the gains are even more pronounced. Based on Census Bureau data, every market in this dataset posted an increase between 2014 and 2024, underscoring a widespread shift toward a more educated workforce with implications for housing demand.
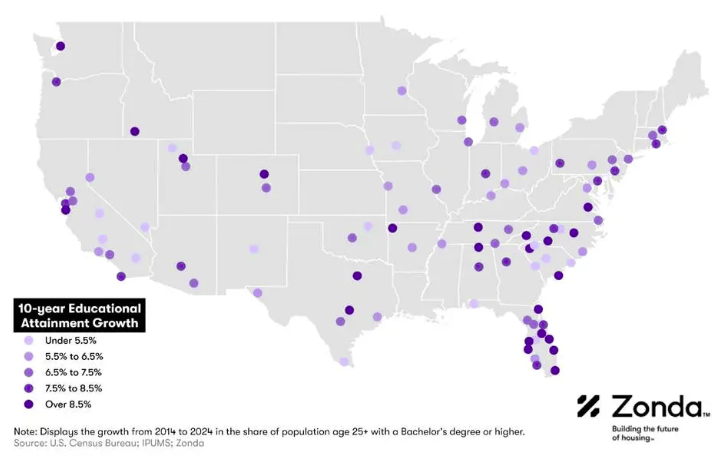
For builders and developers, educational attainment serves as a powerful proxy for long-term housing demand. A higher share of college-educated adults is typically associated with stronger income growth, more stable employment profiles, and greater purchasing power. These characteristics matter especially in an affordability-constrained environment, where higher-earning households are better positioned to absorb rising home costs.
Learn more here.
Big city growth is slowing
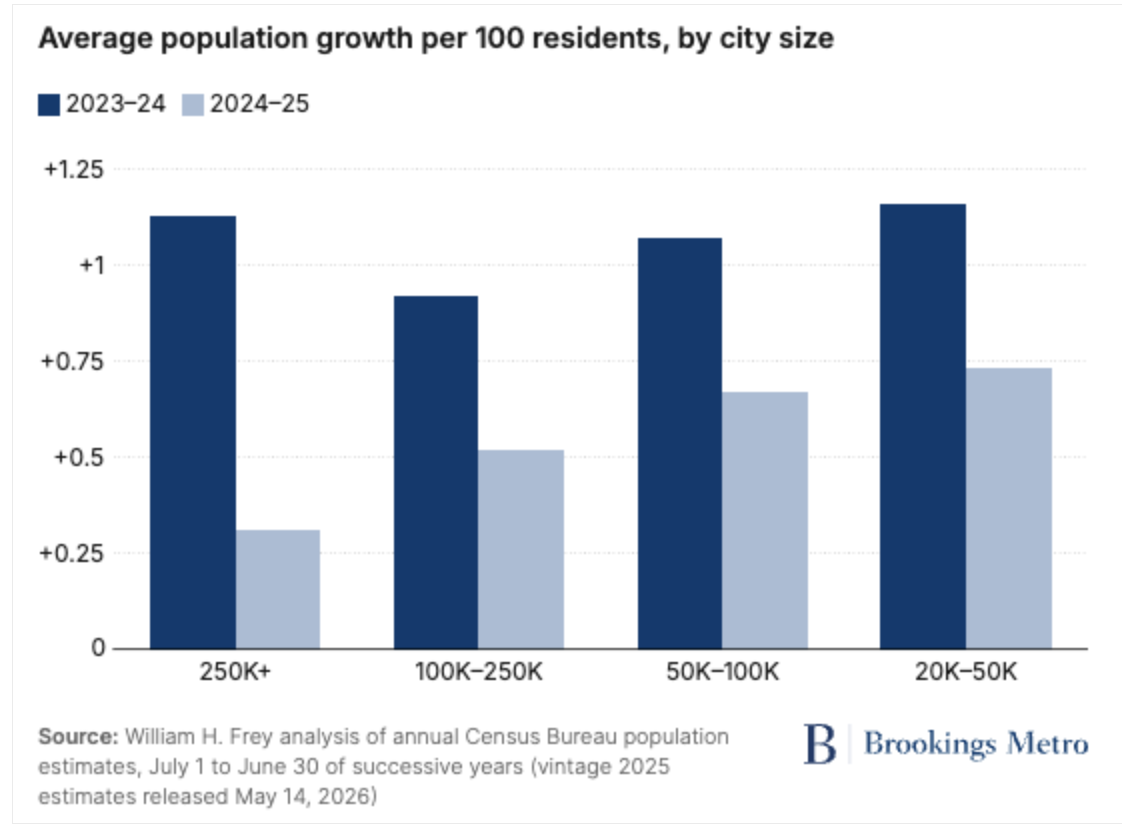
Census Bureau population estimates for 2024-25 show that the rate of population growth in the U.S.slowed over the previous year. This was due largely to a downturn in international migration. This led to declines in growth across most states and metropolitan areas.
More recent Census Bureau releases focus on population change in cities of different sizes. These data show that, as a group, the nation’s 92 largest municipalities (those with populations over 250,000) experienced the largest declines in population growth among all size categories.
Learn more here.
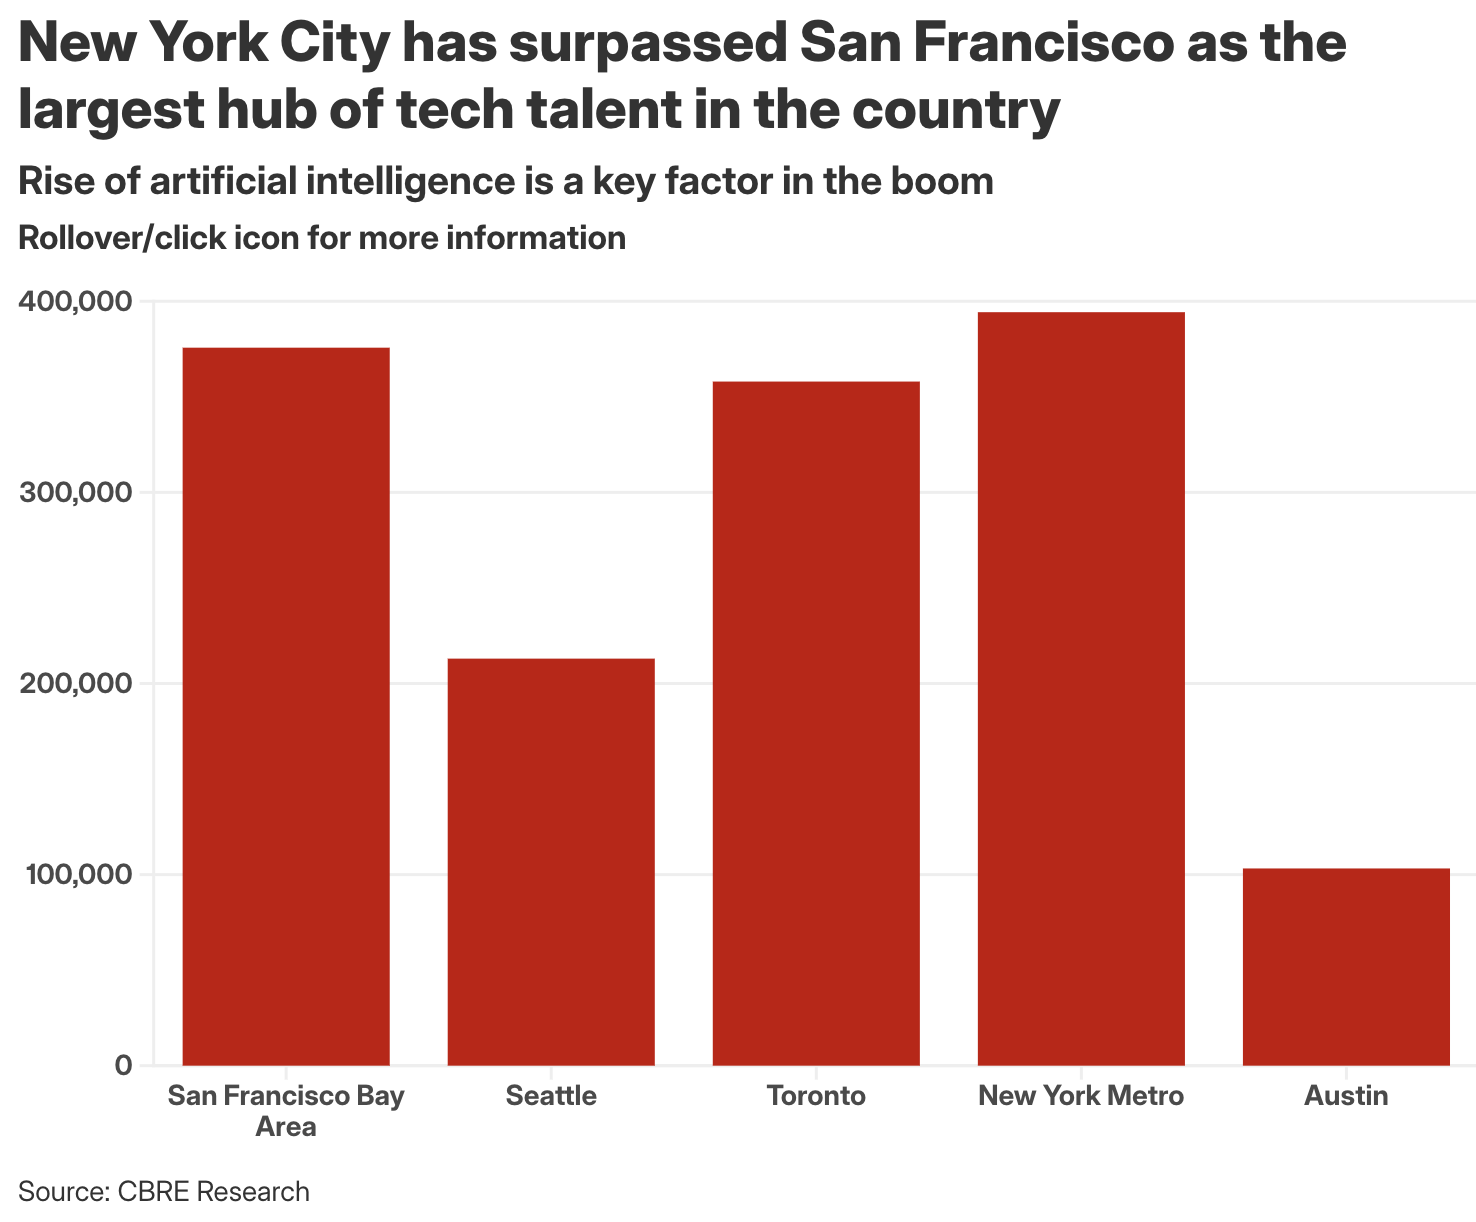
NYC Area surpasses SF Bay Area in tech employment
The number of tech workers based in the New York metro area was 394,300 in 2025 – an increase of 30,640 jobs, or 8.4%, compared to three years ago, according to research from CBRE. In 2025, the San Francisco Bay Area had 375,730 workers – a decrease of 23,900 jobs, or 6%, compared to three years ago, as Silicon Valley endured waves of layoffs.
Learn more here.
Master-planned communities
Top-selling communities in the USA
Per RCLCO’s mid-year survey, new home sales in Master Planned Communities (MPCs) continue to do better than the market overall. While new home sales overall were down just over 6% at mid-year, the top MPCs had improved by year-end, setting a pace just 3% below the top communities of 2024. This data suggests that MPCs will continue to outperform the market throughout 2026, given their lifestyle appeal, amenities, and broader mix of housing products, including more attainably priced detached homes on smaller lots.
The Villages, the nation’s leading active adult community in Florida, once again ranked first overall with 3,611 sales.
Lakewood Ranch in Sarasota, Florida ranked second nationally with 2,085 sales and remains the fastest-selling multigenerational community in the country.
Cadence in Henderson, Nevada earned the third-place rank with 1,247 sales, followed by Babcock Ranch in Punta Gorda, Florida with 1,066 sales, a 34% increase over 2024.
The Houston MSA was once again the top-performing metropolitan area, with 9 communities in the Top 50 and nearly 6,000 sales, comprising 18% of all sales among ranked MPCs.
Florida represented 42% of sales among ranked communities, followed by Texas at 32%.
Looking ahead to 2026, RCLCO expects a modest improvement in the for-sale housing market over 2025, with a moderate increase in total new-home sales, roughly 5%, and low single-digit price appreciation. That assumes mortgage rates remain in a range that does not further erode affordability, and the broader economy avoids a sharp slowdown.
Learn more here.
Housing
Economic uncertainty and affordability challenges
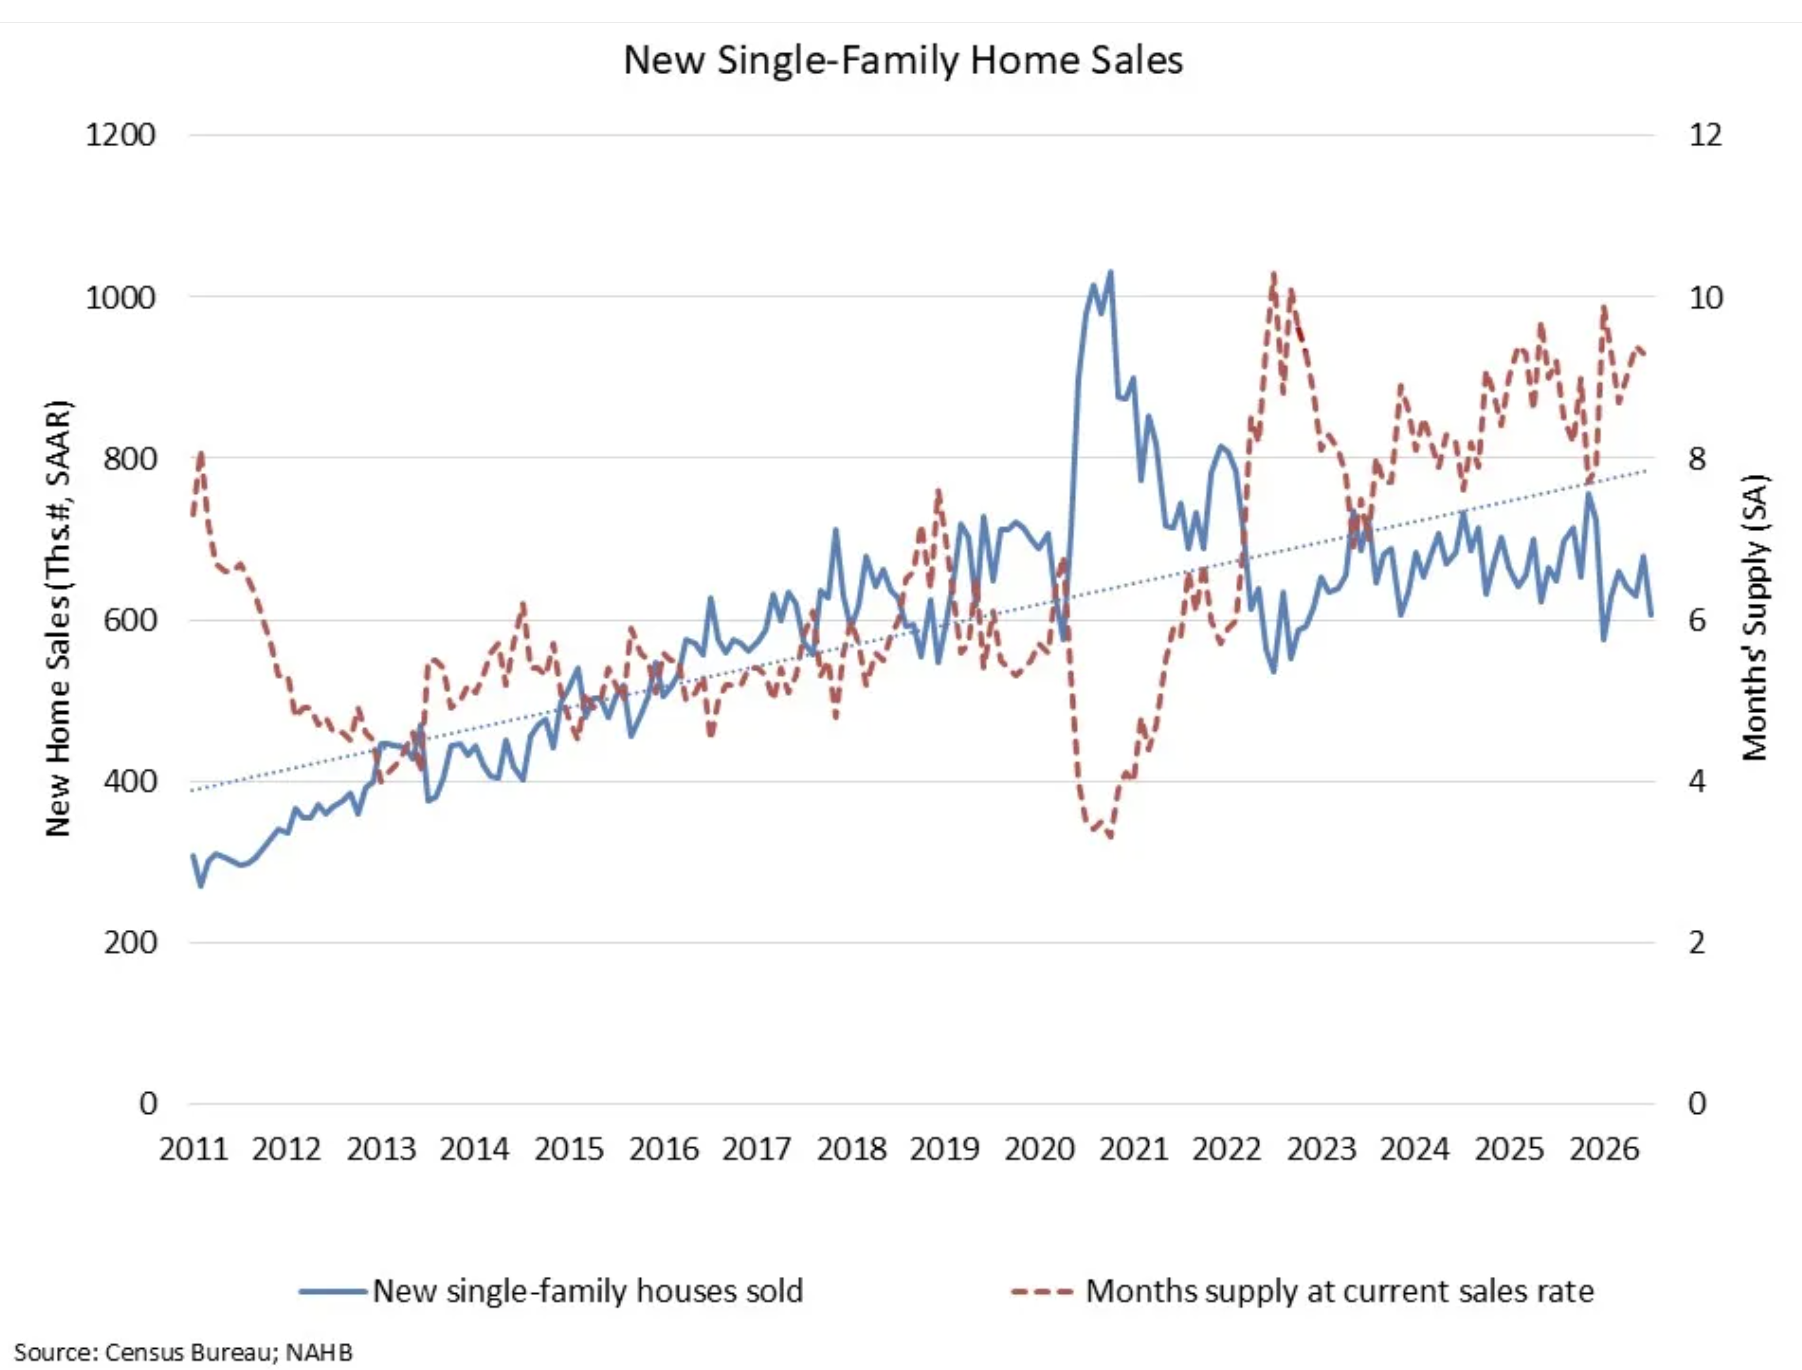
Elevated borrowing costs, rising inflation and broad economic uncertainty continue to curb buyer demand and hold back new home sales. Sales of newly built single-family homes declined 10.5% in July to a seasonally adjusted annual rate of 607,000, following a sharply upward revised June estimate, according to newly released data from the U.S. Department of Housing and Urban Development and the U.S. Census Bureau. The pace of new home sales was 6.3% lower than a year earlier per the July data. The July sales pace was the slowest since January of this year. Mortgage rates increased from 6.1% to above 6.6% from January to July.
Learn more here.
Make it stand out
Whatever it is, the way you tell your story online can make all the difference.
Race for scale amongst home builders
Homebuilding is entering a period of significant consolidation, led by financially strong domestic and international buyers seeking scale, geographic expansion, and efficiency gains. The trend is likely to continue as builders use acquisitions to grow faster than current market conditions allow organically.
Recent mergers and acquisitions are rapidly reshaping the U.S. homebuilding industry. Several top-ranked builders from the 2024 Builder 100 list have been acquired, creating larger organizations that now rank among the industry's biggest players.
Key Trends
Scale is the primary driver. Well-capitalized companies are using their lower cost of capital to acquire competitors and expand market share.
Industry consolidation is accelerating. Major deals involving Taylor Morrison, Tri Pointe Homes, Beazer Homes, M.D.C. Holdings, and others have created several new top-15-scale builders.
Foreign investors are increasingly active. Japanese firms such as Sumitomo Forestry, Daiwa House, and Sekisui House are expanding their U.S. presence through acquisitions.
Notable Examples
Berkshire Hathaway's acquisition of Taylor Morrison creates a platform that would rank among the largest U.S. builders and may enable greater integration across Berkshire's site-built housing businesses.
Dream Finders' acquisition of Beazer Homes expands its footprint in Texas and several Western markets while generating significant cost synergies.
Sumitomo Forestry's acquisition of Tri Pointe Homes and Daiwa House-backed Stanley Martin's acquisitions demonstrate growing international investment in U.S. housing.
Learn more here.
Office conversions in New York City
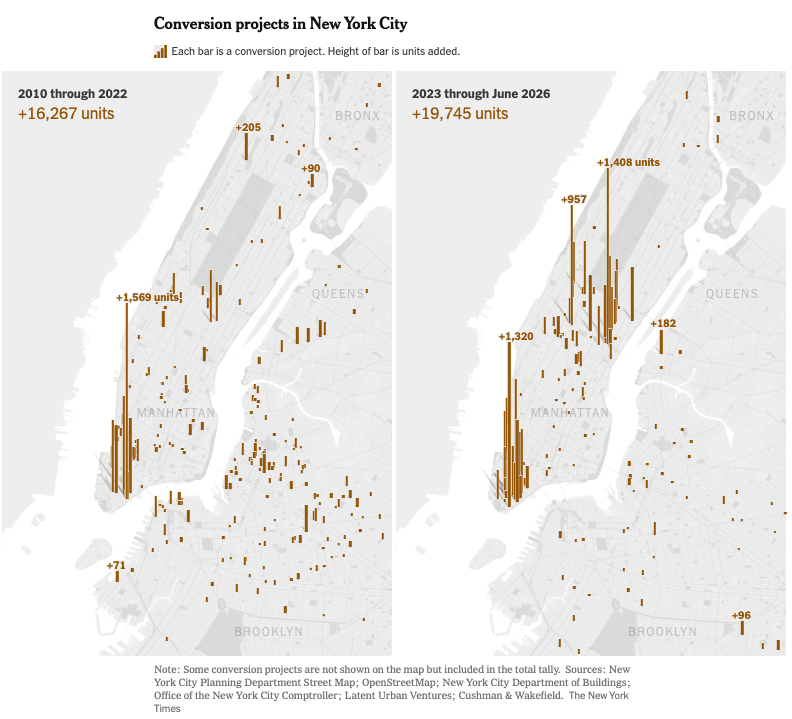
So far this year, New York City has issued permits for 74 such projects that will create roughly 10,100 new homes, according to an analysis of city data by The New York Times. That amounts to a third of all of the new housing permitted in the city during that period.
Since 2023, the city has permitted at least 19,700 units through conversion projects, more units than were approved in such projects between 2010 and 2022, according to data collected by The Times. Many of the homes added in recent years are in large-scale projects across Manhattan.
Conversion projects can be relatively quick to complete compared with new construction. But they are also notoriously complicated, involving reconstructing entire floors, demolishing building interiors to create courtyards and more light, and adding new stories on top of aging structures.
Learn more here.
Make it stand out
Whatever it is, the way you tell your story online can make all the difference.
Potential for office conversions elsewhere
While the office vacancy rate has declined since the pandemic, remote and hybrid work have left hundreds of thousands of square feet unused. At 61,603 potential units, San Francisco ranks second in the nation for "office-to-housing conversion potential," according to a recent study by business debt collection agency The Kaplan Group.
New York City (78,121) is first, while Dallas (57,247) comes in third.
San Francisco, however, has the highest vacancy rate (34.7%) among the 91 major U.S. cities analyzed, although development regulations remain a key barrier.
Like other markets with high vacancy rates, it's experiencing some of the nation's highest underutilization of office space, per the report.
A photo symbolizes an affordability fight
After a reporter posted a photo of attendees at a meeting to discuss the proposal to redevelop a grocery store site in the Marina District of San Francisco, many seized on one detail: Almost everyone in the room was older.
Learn more here.

Financing infrastructure for housing
In most of America, a developer who wants to build a thousand homes on raw land faces an infrastructure problem with no clean solution. The water lines, sewer mains, drainage channels, and roads must exist before anyone moves in, and none of it generates revenue until it does. Cities are often reluctant to fund such infrastructure because existing taxpayers may not support investments benefiting future residents. Counties lack the bonding capacity. State and federal programs are too slow.
Texas looked at this problem and, starting in the 1960s, built a layered system of special-purpose districts that allows infrastructure to be financed, built, and paid for by the people who benefit from it, without requiring cities or counties to carry the risk. Over 2,500 special districts now operate in Texas.
Learn more here.
Office
Office investment trends
The U.S. office market continues to recover, supported by increasing return-to-office activity and nine consecutive quarters of positive demand. Vacancy rates have improved, declining to 15.9% in Q2 2026 from a peak of 17.2% in 2024, while office attendance has rebounded to roughly 76% of pre-pandemic levels.
However, the recovery is uneven. Newer, smaller, and suburban offices are generally outperforming, while older, larger, and downtown properties continue to struggle with higher vacancy rates. Performance differences are significant, with some premium buildings fully leased and achieving rent growth while others remain largely vacant.
Market conditions vary by location. Cities such as Miami, West Palm Beach, Las Vegas, and the Inland Empire have vacancy rates below pre-pandemic levels, and several major metros have posted strong demand growth. At the same time, distress among older office buildings has pushed office loan delinquencies to around 12%, creating opportunities for investors to acquire and redevelop discounted assets.
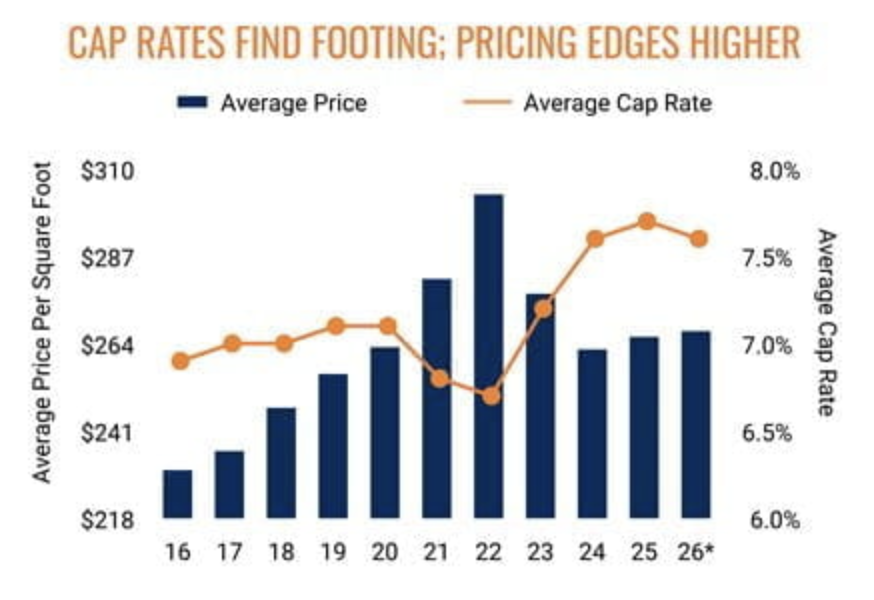
Investment activity remains healthy. Transaction volumes are close to pre-pandemic norms, and office cap rates have stabilized in the mid-7% range, about 100 basis points above 2022 lows. Going forward, continued return-to-office trends are expected to support demand, but success in office investing will depend heavily on selecting the right assets and executing value-add or repositioning strategies.
Learn more here.
Source: Marcus & Millichap
Remote work continues to thrive
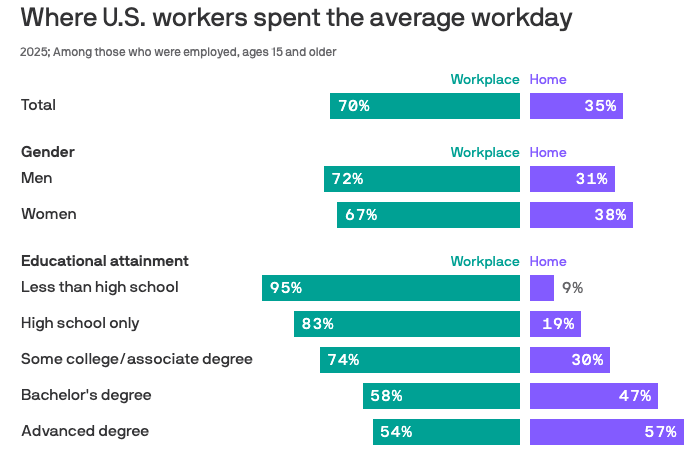
Government data shows that 35% of U.S. workers did some or all of their work at home in 2025 — significantly higher than in the previous decade.
Despite the best efforts of many prominent executives and leaders, we live in a hybrid work world, with more people doing their jobs remotely, and that's led to big societal change. The workplace was permanently altered in the pandemic. In 2019, only 24% of workers did some or all of their work from home. By 2022, that number had risen to 34% and has stayed relatively steady since.
Working from home is mostly for workers with more education.
57% of those with an advanced degree did some work at home in 2025, per the data from the American Time Use Survey.
That's compared with 30% for those with some college or an associate degree.
This helps partly explain the gender divide. Women, who earn a bigger share of college degrees, are more likely than men to work remotely.
Not all employers tolerate remote work. President Trump, for example, ordered government employees to return to working in the office.
Source: U.S. Bureau of Labor Statistics and chart by Danielle Alberti of Axios
Retail
Big box retailers break into urban markets
With their thirst for cheap, sprawling land, big-box retailers usually operate in the suburbs or on the outskirts of town. But in recent years, some have been ditching the traditional model of massive warehouses and vast parking lots in favor of smaller stores in cities and denser communities.
A new strategy involves teaming up with affordable housing developments. As the nation’s housing shortage worsens, more states and municipalities, including California, Florida, Massachusetts, and Philadelphia, have rolled out incentives and financing to encourage housing construction. Retailers like Costco and Target are riding that building push.
Big-box retailers, which sometimes face community opposition over concerns like traffic, can also gain favorable attention by partnering with affordable housing, which is considered a community benefit. Even with these benefits, combining different uses can add complications. Fire-safety needs and noise complaints can differ between residential and commercial buildings. A building with retailers and housing, for example, will need separate entrances with different levels of security features.
A Target store on 125th Street in New York City’s Harlem faced concerns not only about finding adequate space but also about logistics like where to unload merchandise. That would normally happen in a parking lot behind a store. It took four years to arrive at a solution: add interior locking docks with entrances on 126th Street, while retail tenants enter from 125th Street, Harlem's main commercial corridor.
Learn more here.
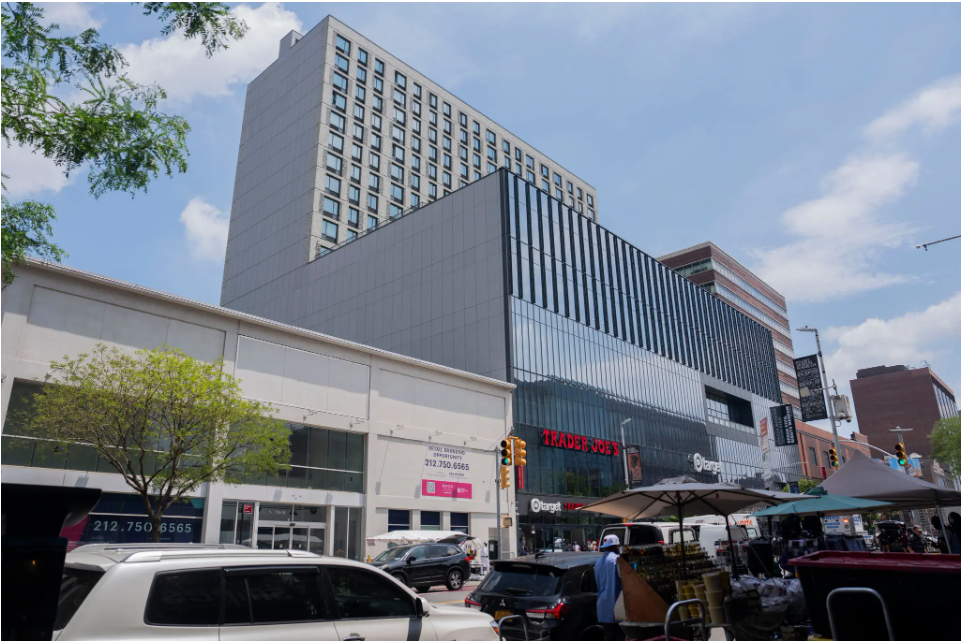
The Target store on 125th Street in New York City is in a complex with 171 affordable housing units. Photo by Hiroko Masuike for The New York Times
Family Dollar closes 350 stores
In March 2024, discount retail giant Dollar Tree, the parent company of Family Dollar, first announced plans to close around 1,000 locations. According to a later 2024 annual report, the company confirmed the exact progress of its optimization plan, highlighting that “as of February 1, 2025, we had closed approximately 695 stores.”
A more recent analysis by Local Falcon reveals Family Dollar has permanently closed at least 350 stores between July 7, 2025, and May 12, 2026. These closures represent a 4.69% reduction in the chain's size, suggesting the retailer still operates about 7,112 locations across the country. According to Dollar Tree’s filing with the Securities and Exchange Commission, on February 3, 2024, there were 8,359 Family Tree locations. The numbers suggest that over the past two years, 1,247 Family Dollar locations were closed.
Meanwhile, the popular discount chain underwent a major business change when Dollar Tree sold the entire Family Dollar business segment to Brigade Capital Management and Macellum Capital Management for roughly $1 billion in cash, according to Dollar Tree's press release on July 7, 2026.
Reduced building reshapes retail real estate
Rising construction costs and store closures slowed many retail projects during the past few years. Retailers have now absorbed much of the vacant space left behind by store closures.
Limited additions to retail supply are supporting rent growth. Despite broader concerns about inflation and household financial pressure, some retail categories remain fundamentally resilient, particularly necessity-based retail and centers serving higher-income consumers.
While retail fundamentals have improved overall, performance disparities across the sector remain significant. The highest-performing malls continue to post strong net operating income growth, while weaker malls increasingly face conversion into logistics facilities, mixed-use developments, or other uses.
One of the biggest obstacles to mall redevelopment remains fragmented ownership structures. Anchor tenants often control their own buildings and parking fields, which complicates large-scale repositioning efforts. Municipal support often becomes critical to moving redevelopment projects forward.
Learn more here.
Some retail malls thrive
Some shopping malls, like so many sectors in the economy, are making a K-shaped recovery, with those that serve the highest-end customers seeing a surprise resurgence. There are roughly 900 malls in the United States, but only a small sliver are successful. The top 100 account for 50 percent of the entire sector’s value, according to Vince Tibone of the analytics firm Green Street, whereas the bottom 350 make up 10 percent.
Revenue at class A malls is growing by 5 percent each year, and financing is easy to come by. The commercial mortgage-backed securities for this market doubled from $4 billion in 2024 to roughly $8 billion in 2025.
GGP, a division of Brookfield Corporation that focuses on malls, has seen its top-tier assets thrive since the pandemic waned. Across 100 mall properties, its occupancy rate is hovering around 95 percent. Tenant sales have risen nearly 20 percent since 2019, and sales per square foot at some trophy properties have climbed 60 percent over the same time period.
Many retail malls struggle
Like most American malls, Palisades Center, a sprawling four-story complex in New York’s Hudson Valley, is struggling. In the early 2000s, it was valued at over $880 million, drew 24 million shoppers per year, and even boasted a skating rink that was inaugurated by the Olympic figure skater Nancy Kerrigan. But after being saddled with debt and abandoned by its anchor tenants, including JC Penney, which is now bankrupt, the troubled shopping mall was sold at auction earlier this year for just $175 million.
Most malls are in a death spiral, with revenue shrinking by about 5 percent a year across properties labeled “Class B” and “Class C.” According to commercial real estate analytics firm Trepp, 11.2 percent of the $53.23 billion in loans backed by regional and “super-regional” malls are delinquent, compared with 7 percent for all commercial mortgage-backed security retail loans.
These distressed malls have difficulty signing tenants, which deters customers, which plunges their value, which puts further pressure on the debt load. About 40 malls close per year in the United States.
The pandemic accelerated the decline of these lower-tier malls, with three major property owners—CBL Properties, Washington Prime Group, and Pennsylvania Real Estate Investment Trust— filing for bankruptcy from 2020 to 2023.
Learn more here.
Hospitality
Hotel outlook
A new hospitality investment cycle is emerging. Strong debt markets, near-record dry powder (capital waiting for good investment opportunities), investors' appetite for yield, and renewed confidence in sector performance are converging with slowing supply additions to create exceptional opportunities.
According to JLL’s Hotels and Hospitality Group, the hotel sector has demonstrated remarkable resilience, with 2025 investment volumes rising 22% from 2023 lows. International tourist arrivals have exceeded pre-pandemic levels, and air passenger volumes are projected to grow 4.9% in 2026.
In 2025, top global markets saw varied RevPAR (revenue per available room) performance driven by several factors, including post-pandemic recovery patterns, the pace of the return of business transient travel, and differences in supply additions.
Cities like Miami, which led the way in pandemic recovery, have normalized over the past several years, while initial laggards like San Francisco and some cities in the Asia Pacific region experienced outsized growth in 2025.
Economic and geopolitical factors create additional performance divergence across these markets. Currency fluctuations impacted international visitor flows, while local economic strength influenced both business and leisure travel.
Regulatory environments, including travel restrictions and tourism policies, continue to influence visitor volumes across regions. Markets like Bengaluru are benefiting from significantly increased office leasing and business travel, while some U.S. gateways faced reduced international tourist arrivals or shifts in travel patterns, particularly from Canada.
The hotel sector has once again shown exceptional resilience, and hotels’ share of transaction volumes has rebounded to 8% of commercial real estate transaction volumes in 2025, slightly surpassing the long-term average share.
Learn more here.
Middle-class dining chains suffer
Known for its giant portions, Claim Jumper is down to just four locations. Other once-thriving chains, including Denny’s and Applebee's, are also being squeezed.
Restaurant costs are increasing. This includes rent and labor costs as well as prices for commodity goods like beef and butter.
On the demand side, cost-conscious middle-class consumers dine out less and less. According to comprehensive data from YouGov, 33% of middle-income diners state they are visiting restaurants less frequently than they did a year ago. And a staggering 82% of all U.S. diners report noticing substantial menu price increases, with the vast majority citing general cost-of-living pressures as their primary reason for staying home.
Bank of America credit card tracking reveals that mid-tier casual dining chains and pizza parlors have experienced multi-year market share declines. Middle-class consumers aren't entirely abandoning restaurants, but they are dramatically scaling back how much they spend per visit.
The rapid decline of these nostalgic former stalwarts of middle-class dining as well as more recent dining concepts is startling.
Industrial
Outlook for industrial real estate
According to an analysis from commercial real estate brokerage and capital markets advisory firm Marcus & Millichap (NYSE: MMI), short-term frictions emerge as long-term growth drivers of industrial real estate remain intact.
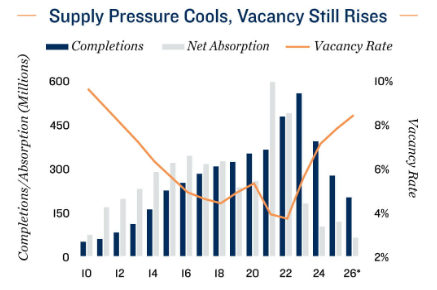
Supply trends influence vacancy movement
The recent surge in industrial construction pushed vacancy higher in recent years, though performance differs by property size and vintage.
National industrial vacancy has risen 420 basis points to 7.8 percent as of March 2026, up from its record low in mid-2022.
A post-pandemic slump in space demand and a construction wave that added 2.1 billion square feet during 2020-2024 drove the rise, expanding inventory by 12.7 percent.
Although construction has slowed, another 200 million square feet of industrial space is slated for 2026, pushing the national vacancy rate to a projected 8.4 percent by year-end.
Infill warehouses between 10,000 and 50,000 square feet average 4.5 percent, compared with 11.1 percent for properties between 200,000 and 750,000 square feet.
However, strong wage growth over the past three years has supported household balance sheets, keeping debt as a share of income at its lowest level in more than 15 years.
Vacancy among facilities over 750,000 square feet declined to 7.6 percent from late-2025, while newer properties delivered since 2020 saw vacancy fall 470 basis points to 19.8 percent from a mid-2024 peak.
Multiple crosscurrents shape outlook
A thinning supply pipeline, coupled with e-commerce growth, provides support, while inflation and retail inventory adjustments pose risks.
A sharp deceleration in construction is emerging as a key tailwind, with 2026 industrial development forecast to be 64 percent below the 2023 peak, easing future supply pressure.
Inflation-adjusted retail sales continue to rise, with e-commerce penetration reaching 23.2 percent of core retail sales as of March, and total e-commerce sales up 7.2 percent annually.
Producer prices climbed to 6.0 percent year-over-year, driven by elevated energy prices, higher transportation costs, and significant increases in global shipping and trucking expenses.
These cost pressures and retailer inventory drawdowns may temper near-term absorption, though long-term industrial performance remains supported by structural e-commerce trends.
Investor conviction remains firm
Deal flow has risen, with price appreciation supported by long-term demand drivers, despite short-term headwinds.
Industrial investment activity remains historically strong, with transaction counts over the past 12 months through March ranking second only to the 2021 peak.
Concurrently, cap rates have seen modest downward pressure, with the national industrial cap rate averaging 6.8 percent.
Yields vary meaningfully by asset size, with large facilities exceeding 750,000 square feet averaging a 6.4 percent cap rate, while smaller properties between 10,000 and 50,000 square feet averaged closer to 7.3 percent.
Investor focus remains on long-term demand drivers, particularly for online retail growth and its implications for industrial assets such as warehouses and logistics space.
Near-term performance remains uneven as tariffs, elevated fuel costs, and global shipping disruptions weigh on operating conditions and tenant demand.
Over the long run, moderating construction activity and rising e-commerce penetration are expected to support fundamentals, reinforcing a positive outlook for the industrial sector.
Learn more here.
* Forecast
Sources: Marcus & Millichap Research Services; Bureau of Economic Analysis; Bureau of Labor Statistics; CoStar Group, Inc.; DAT Freight and Analytics; Freightos; Real Capital Analytics; U.S. Census Bureau; U.S. Department of Transportation